...
...
...
...
...
...
...
...
...
...
...
...
...
...
...
...
...
...
...
...
| Warning |
|---|
Our Cloud Help Center has a new home at https://help.tempo.io/cloud/
We will no longer be updating Cloud documentation in this space, so please be sure to check the new site for the latest documentation and learning content. |
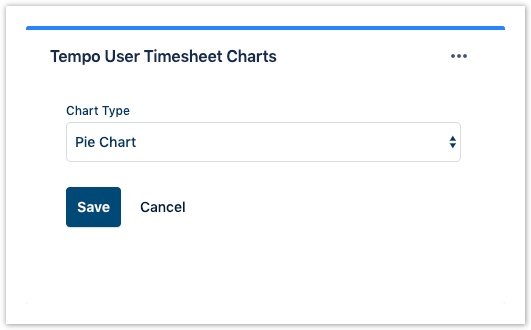
The User Timesheet Charts gadget shows your logged time for a current period. The data can be displayed using pie chart, column chart, or area chart.
For information about how to add the gadget to your Jira dashboard, see
...
/wiki/spaces/HCA/pages/374473077.
To configure the User Timesheet Charts gadget:
- Go to your Jira dashboard and click
in the upper-right corner of the User Timesheet Charts gadget.
- Select Edit.
- Select the chart type in Display to illustrate the data in the most meaningful way to you.
- Select how often you would like the date to be refreshed in Refresh Interval.
- Click Save to display the results in a graph.
Related Topics
...