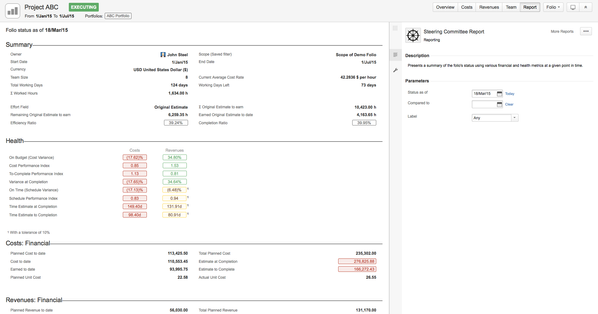
Steering Committee Report
The Steering committee report presents a summary of the folio's status at a given date. It shows the same financial and health metrics provided by the folio's Overview in deeper details, calculated for the specified date. To access this report, click on the Report tab (or hit '6') and then click on the 'View report' button next to the Steering committee report preview. This will bring up the report with today's date as default. To change the date for which to get the status, simply change the date in the 'Status as of' field. The report will be automatically refreshed when the date changes.
This report is available for folios and portfolios.
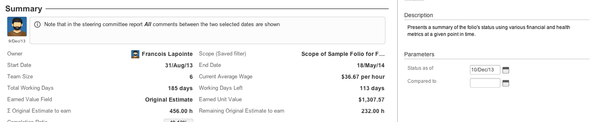
Summary
The summary section shows basic folio information such as name, description, scope information, staff count, etc. The information displayed in the summary differs whether the folio uses Earned Value Management or not.
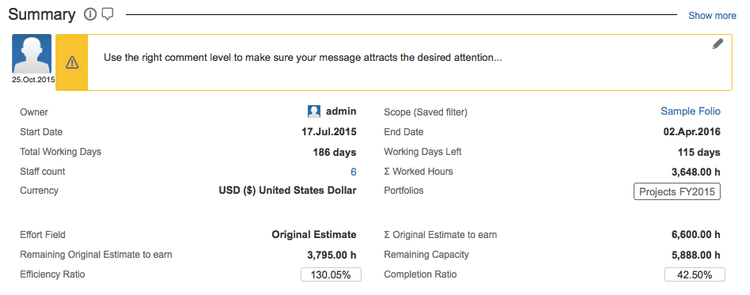
The following table describes the various fields of the summary section.
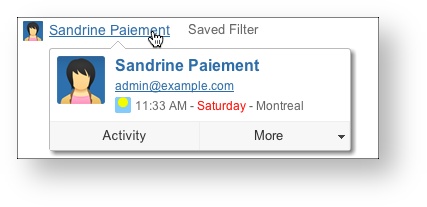
| Owner | Current Owner of the Folio. Clicking on the name name will take you on his or her JIRA User information page. Hovering the mouse over the name will open an inline dialog box that offers more information and actions related to that user.
|
|---|---|
| Scope (Saved filter) | JIRA Saved Filter defining the Folio's Scope. |
| Start Date | Date from which expenses and revenues defined in the folio are taken into account. This is the start date of the project |
| End Date | Date until which expenses and revenues defined in the folio are taken into account. This is the planned end date of the project. |
| Currency | Currency used for amounts in this folio. |
| Portfolios | List of the portfolios associated with the folio |
| Closed Date | [Only when Folio is closed] Date at which the folio was closed. |
| Staff Count | Number of members currently in the folio's staff. |
| Current Average Cost Rate | Current average staff member wage. |
| Total Working Days | Total number of working days between the start and end date of the folio. Working days are computed based on the Folio's Working Schedule configuration. |
| Working Days Left | Number of working days left until the planned completion date. Working days are computed based on the Folio's Working Schedule configuration. |
| Σ Worked Hours | Total number of hours worked by the staff members of this folio. |
| Effort Field | Numeric Issue Field used to determine the weight of each issue it terms of effort when it is completed. This field is used for Earned Value calculation in the case of a Folio using EVM. Please refer to the Effort Field description of the Folio Configuration page for more details. |
Σ Effort Field to earn | Indicates the sum of the Effort Field for all issues part of the folio's scope if no Fixed Total Effort have been specified. Otherwise indicates the specified Fixed Total Effort. |
| Remaining Effort Field to earn | Indicates the sum of the Effort Field for all unresolved issues of the Folio. Unresolved issues are the ones with a status that is not in the list of statuses considered as completed, as defined by the Completed Issues setting in the Folio's configuration. |
| Completed/Earned Units | Indicates the sum of the Effort Field for all completed issues of the Folio. Completed issues are the ones with a status that is in the list of statuses considered to be completed, as defined by the Completed Issues Folio configuration setting. |
| Efficiency Ratio | [Only if Effort Field is set to Original Estimate] The efficiency ratio determines how well the effort was originally estimated. It is computed by dividing the sum of time spent on completed issues by the sum of their original estimates. A ratio lower than 100 indicates that the effort was underestimated. |
| Completion Ratio | An indication on the current progress of the project. Using EVM, it is the proportion of Earned Value to date (defining earned value) vs the final Planned Value and is computed by dividing the Earned Value to date by the final Planned Value. Without EVM, this value is calculated either by dividing the amount of worked hours to date by the worked hours plus the sum of remaining estimates OR by the project calendar progress. See section on the Completion Ratio for more details. |
| Custom Field values | Folio custom fields and their values. Only fields with a non-blank value are displayed. |
 | Inline Help. Clicking on the icon opens up an inline dialog containing definitions of elements displayed in section. |
| Manage section Comments. |
Health
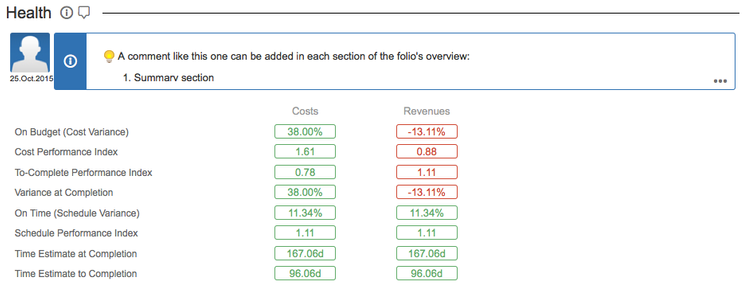
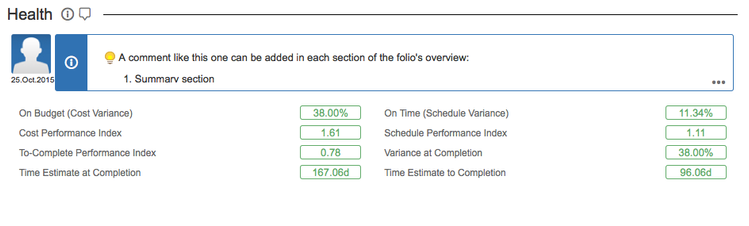
The Health section of the report shows the EVM metrics of the folio. If the folio is tracking revenues, then two sets of EVM metrics are shown side by side, the first column showing Costs-based metrics, the second one showing Revenues-based metrics.
Folio with revenues
Folio without revenues
The following table describes the various fields of the Health section.
| On Budget (Cost Variance) | Cost Variance (CV) determines if the project is under or over the budget. It is computed by subtracting the Actual Cost from the Earned Value divided by the Earned Value. A negative value indicates that the project is over budget. |
|---|---|
On Time (Schedule Variance) | Schedule Variance (SV) determines whether the project is ahead of or behind schedule. It is computed by subtracting the Planned Value to date from the Earned Value divided by the Planned Value to date. A negative value indicates that the project is behind schedule. |
| Cost Performance Index | Cost Performance Index (CPI) determines how efficiently the staff members are using the resources. It is computed by dividing the Earned Value by the Actual Cost. A value lower than one indicates a loss of efficiency. |
Schedule Performance Index | Schedule Performance Index (SPI) determines how efficiently the project staff members are using their time. It is computed by dividing the Earned Value by the Planned Value to date. A value lower than one indicates a loss of efficiency. |
| To-Complete Performance Index | To-Complete Performance Index (TCPI) determines the efficiency (CPI) that must be achieved on the remaining work for a project to meet the Budget at Completion. It is computed by dividing the work remaining (BAC - EV to date) by the budget remaining (BAC - AC to date). A value greater than one indicates that the performance must improve. TCPI is undefined if the BAC is 0 or if AC is greater than BAC. |
| Time Estimate at Completion | Time Estimate at Completion (EACt) determines a rough estimate of how many total working days the project require to be complete given the current trend. It is compared to the planned number of working days do determine if it is positive or negative. It is computed by dividing the Total Working Days by the Schedule Performance Index (SPI). |
| Time Estimate to Completion | Time Estimate at Completion (ETCt) determines a rough estimate of how many working days are required to complete the project given the current trend. It is computed by simply subtracting the worked days from the estimated time at completion (EACt) |
| Variance at Completion | This index (VAC) determines whether the project will finish under or over budget. It is computed by subtracting the Estimate at Completion from the Budget at Completion, divided by the Budget at Completion. A negative value indicates how much more money will need to be injected to achieve the project goal. |
Comments
When a Folio is not using EVM, the Health section is replaced with an extra space for entering comments. When this section contains no comment, it will display the description of the Folio.
Financial
The Steering Committee report can show one or two Financial sections depending whether or not the Folio is tracking revenues. The Financial sections display a summary of money related information, such as planned, actual and earned value totals to date and forecasts based on current performance.
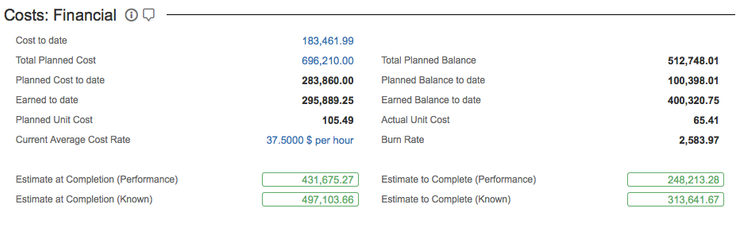
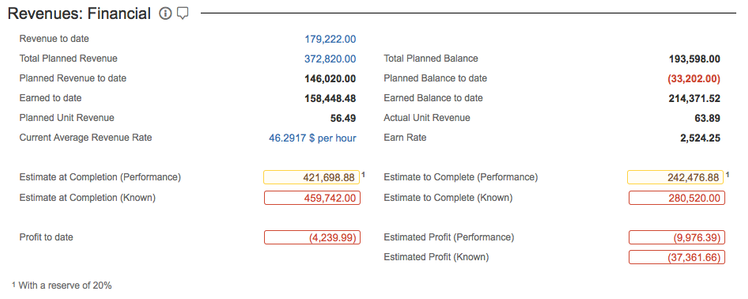
The following table describes the various fields of the financial sections.
| Costs to Date | [Costs: Financial only] Actual cost of the Folio as of today. |
|---|---|
Total Planned
| Total Planned Value for the Folio. This is the total planned cost or revenue of the entire Folio, from start date to end date. Clicking on the amount takes you to the Planned Costs or Planned Revenues, as appropriate. If budget has been approved, then the Total Planned value reflects the last budget baseline and a note is displayed at the bottom of the section describing that baseline. |
| Total Planned Balance | Indicates the remaining amount of the total planned cost (or revenue) that is available as of today. Example: Given a Folio with a total planned value of 100,000$ and a actual cost to date of 90,000$, then the total planned balance = 100,000$ - 90,000$ = 10,000$ |
| Planned to Date | Sum of all planned expenses to date. This is the total costs or revenues planned as of today. If budget has been approved, then the Planned to Date value reflects the last budget baseline. Must not be confused with Planned Value (PV) which is used in EVM indices calculations and is an indication of the current project schedule progress. |
| Planned Balance to date | The Planned Cost Balance to date indicates the planned cost variance as of today. Example: Given a Folio with a planned cost to date of 20,000$ and a actual cost to date of 25,000$, then the planned balance to date = 20,000$ - 25,000$ = (5,000$) |
| Revenue to Date | [Revenues: Financial only] Actual revenue of the Folio as of today. |
| Earned to date | [EVM only] Indicates the Earned Value as of today. It is a proportion of the Total Planned Value. This proportion is the sum of the Earned Value Field for all resolved issues divided by the sum of the Earned Value Field for all issues. |
| Earned Balance to date | [EVM only] Indicates the remaining value to complete from the total planned cost (or revenue). Example: Given a Folio with a total planned cost of 100,000$ and with a earned to date of 25,000$, then the earned balance to date = 100,000$ - 25,000$ = 75,000$ |
| Planned Unit Cost | [Costs: Financial only] Planned cost value of one unit of the Earned Value Field (or an hour of Original Estimate in the case of a non-EVM Folio). It is computed by dividing the Total Planned Cost by the sum of the Earned Value Field (or Original Estimates) for all issues of the Folio. If budget has been approved, then the Planned Unit Cost value reflects the last budget baseline. Example: Given a Folio with issues totaling 100 Story Points and a budget of 100,000$, then Planned Unit Cost = 100,000$ / 100 = 1,000$. |
| Planned Unit Revenue | [Revenues: Financial only] Planned revenue value of one unit of the Earned Value Field (or an hour of Original Estimate in the case of a non-EVM Folio). It is computed by dividing the Total Planned Revenue by the sum of the Earned Value Field (or Original Estimate) for all issues of the Folio. If planned revenues have been approved, then the Planned Unit Revenue value reflects the last planned revenues baseline. Example: Given a Folio with issues totaling 100 Story Points and a planned revenue of 200,000$, then Planned Unit Revenue = 200,000$ / 100 = 2,000$. |
| Actual Unit Cost | [Costs: Financial only] Actual cost value of one unit of the Earned Value Field (or an hour of Original Estimate in the case of a non-EVM Folio). It is computed by dividing the Actual Cost to date by the sum of the Earned Value Field for all earned issues of the Folio (or Completed Original Estimates). Example: Given a Folio with completed issues totaling 50 Story Points and a cost to date of 100,000$, then Actual Unit Cost = 100,000$ / 50 = 2,000$. |
| Actual Unit Revenue | [Revenues: Financial only] Actual revenue value of one unit of the Earned Value Field (or an hour of Original Estimate in the case of a non-EVM Folio). It is computed by dividing the Actual Revenue to date by the sum of the Earned Value Field for all earned issues of the Folio (or Completed Original Estimate). Example: Given a Folio with completed issues totaling 50 Story Points and a cost to date of 200,000$, then Actual Unit Cost = 200,000$ / 50 = 4,000$. |
| Current Average Cost Rate | [Costs: Financial only] Average cost of one worked hour in the project. This takes only salaries into account and is the current average hourly rate weighted by each member's percentage of availability. |
| Current Average Revenue Rate | [Revenues: Financial only] Average revenue of one worked hour in the project. This takes only billed rates into account and is the current average hourly rate weighted by each member's percentage of availability. |
| Burn Rate | [Costs: Financial only] Indicates the average amount spent per working day since the folio start. Example: Given a Folio with a cost to date of 100,000$ and that has consumed 5 working days of its time frame, then the Burn rate = 100,000$ / 5 = 20,000$ / day |
| Earn Rate | [Revenues: Financial only] Indicates the average amount earned per working day since the folio start. Example: Given a Folio with a revenue to date of 100,000$ and that has consumed 5 working days of its time frame, then the Earn rate = 100,000$ / 5 = 20,000$ / day |
| Estimate at Completion (Performance) | Estimated total cost (or revenue) of the project at the estimated end of the project (when all current scope should be completed, given the current performance). It is the highest value between the future known actual cost at completion and the projected final cost based on past performance. When using EVM, the projected final cost by dividing the Total planned cost by the Cost Performance Index (CPI). See Forecasts for details on projections. When not using EVM, the projected final cost is calculated by dividing the total budget by the Completion Ratio. The color of this index is green when Actual is less than Planned and red otherwise. The Reserve in the Folio's Accounting configuration, if set, determines a range of values above Total planned value for which the Estimate at completion will turn amber instead of red. For revenues, the colouring will depend on another configuration setting (Accounting > Track Revenues > As Client Costs). If this is option is deselected, then the reverse reasoning is applied for colouring Estimate revenues at Completion (green when above planned, and conversely). |
| Estimate to Complete (Performance) | Estimated cost remaining (or revenue expected) until the estimated project's end date, based on past performance (CPI). It is the difference between the current actual cost (or revenue) and the Estimate at completion. The color of this index is the same as the color of the corresponding Estimate at Completion. |
| Estimate at Completion (Known) | Estimated total cost (or revenue) of the project at the projected end of the project based on known future costs (revenues) recorded under Costs (Revenues) > Actual. In other words, it is the sum of Estimate to Complete (Known) + Cost (Revenue) to date. See the description of the Estimate at Completion (Performance) indice to understand the colouring of this indice. |
| Estimate to Complete (Known) | Estimated cost remaining (or revenue expected) until the completion of the project based on future, known actual costs (revenues), recorded under Costs (Revenues) > Actual. Estimate to Complete (Known) is calculated by: (1) determining the latest between the projected end date (based on current performance) and planned end date, and then (2) simply summing up future actuals (listed under Costs (Revenues > Actual) up until that date. |
| Profit to Date | [Revenues: Financial only] The Profit to date is the subtraction of the total revenues to date from the total costs to date. An amount greater than zero indicates that the project is currently profitable. The color of this index is green if positive and red if negative. |
| Estimated Profit (Performance) | [Revenues: Financial only] The Estimated Profit based on performance is the estimated total profit at the end of the project based on the costs and revenues performance indexes. It is computed by subtracting the Estimate Cost at Completion (Performance) from the Estimate Revenue at Completion (Performance). The color of this index is green if positive and red if negative. |
| Estimated Profit (Known) | [Revenues: Financial only] The Estimated Profit is the estimated total profit at the end of the project based on the known costs and revenues. It is computed by subtracting the Estimate Cost at Completion (Known) from the Estimate Revenue at Completion (Known). The color of this index is green if positive and red if negative. |
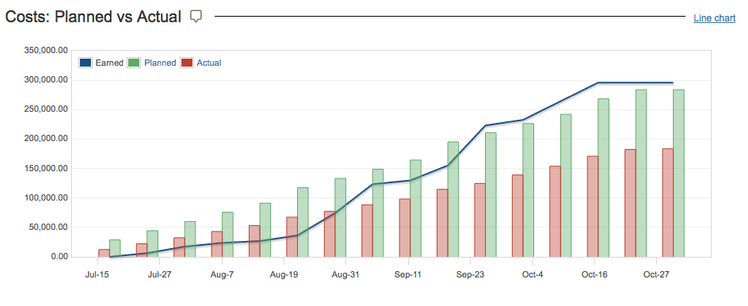
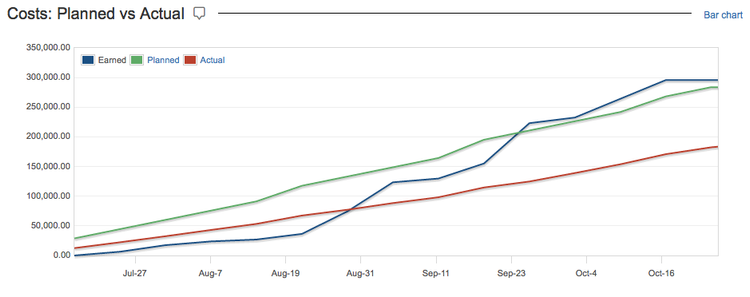
Budget vs Actual
The Steering Committee report can show one or two Budget vs Actual sections depending whether or not the folio is tracking revenues. The Budget vs Actual sections show a chart showing the evolution of the folio's Planned, Actual and Earned Values (if EVM is used) over time since the folio's start date.
Configuring the report
This report can also display indices variations to another date by selecting it in the 'Compared to' field. The following figure shows the Steering committee report with a comparison (reference) date. This feature is only available for folios.
Indices variations are indicated as a colored percentage right next to the index value. They are colored in order to indicate that the change is good (green), that it requires vigilance (yellow) or that it is bad (red). The rules for coloring are the following:
- If an index did not change, it is colored black
- If an index moved toward its optimal value, then it is colored green
- If an index moved away from its optimal value, but is still considered good (has green background), then it is colored yellow
- If an index moved away from its optimal value and is not considered good (has yellow or red background), then it is colored red.
Note that it means a variation might show up in green when an index increases while the same variation would be shown in red for another index. It all depends on what the optimal value is for that index.
Example 1: Index degraded but still good

The report shows that the Cost Variance index has decreased by 16.68% between the two compared dates. It also indicates that the index is in good shape, but has moved away from its optimal value (positive infinity) since the variation is shown in yellow.
Example 2: Index improved

The report shows that the Schedule Performance index has increased by 1.30% between the two compared dates. Even though the SPI of 0.78 is still considered bad (as indicated by the red background), the index variation indicates an improvement (show in green) since the index has moved towards the its optimal value (positive infinity).
Example 3: Index degraded and not good

The report shows that the To-Complete Performance index has increased by 5.21% between the two compared dates. It also indicates that it is a degradation since the index moved away from its optimal value. The variation is shown in red since the current index value is not good.
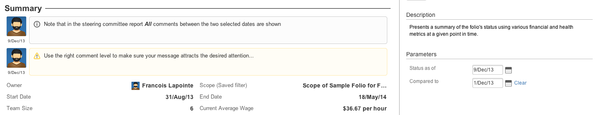
Comments
If you entered comments in the folio or portfolio overview or in one of their summary screens, they will be displayed in the Steering Committee Report. If you did not specify any date in the field 'Compare to', only the latest comment with a date equal or before to the date you specified in the field 'Status as of' is displayed.
If you specify a date in the 'Compare to' field, then all comments between the 'Compare to' date and the 'Status as of' date inclusively are displayed.
Configuring the report
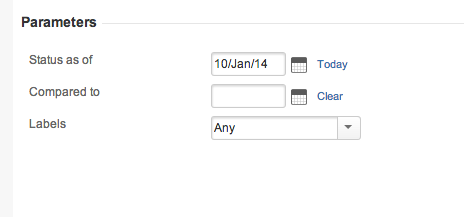
| Status as of | Status as selected date |
|---|---|
| Compare to | Reference Date that allows you to see indices variations |
| Label | This allows you to display amounts for the selected Jira Issue Label. (not available at the portfolio level) Note : see Using Labels for more info on. |
Printing
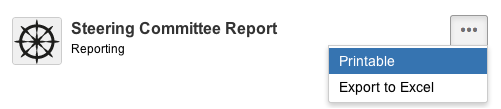
To get a printing-friendly version without the application template around it, first open the report, then click the 'Printable' item in report's drop-down menu (top right of the parameters panel on the right) or simply by hitting "p" key.
Printing the Steering committee report
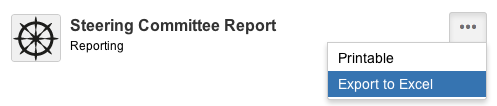
Export to Excel
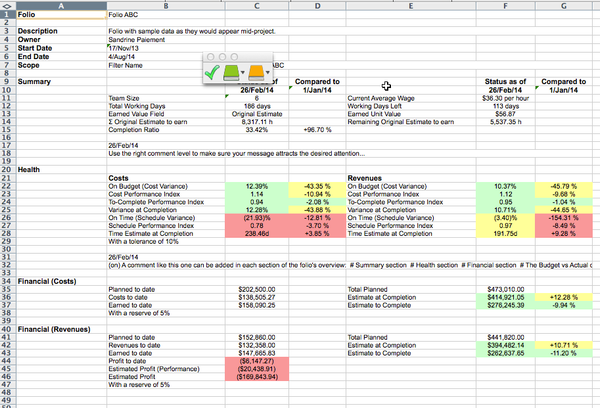
The report can be exported to Excel format to give you all the latitude you need to further digest, analyze or graph the data. Do it by selecting the "Export to Excel" item in the report's action menu found on the top right of the report's parameters panel. Export differ slightly depending if you are visualizing a Folio or a Portfolio steering committee
| Folio |
|---|
|
 |
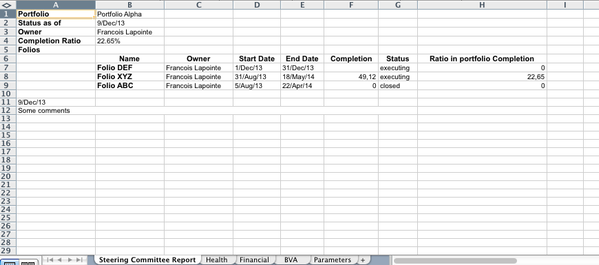
| Portfolio |
| Steering committee report sections are displayed on separate spreadsheet |
 |
Tempo for Server Documentation
For the newest versions of Tempo documentation, please visit our Help Center. For support, see our Support Portal.