Profitability Report
The Profitability report presents a periodic comparison of actual costs and revenues over time. It is available from the reports page only when the current folio is configured to track revenues. To access this report, click on the Report tab and then click on the 'View report' button next to the Profitability report preview. This will bring up the report with the first day of the current month as the default start (From) date and today's date as the default end (To) date. The report will be automatically refreshed when one of its parameters changes.
The report first presents a bar chart showing two bars for each selected period: a yellow bar indicating the revenues and a red bar indicating actual expenses. Hovering the bars will open a tooltip showing the precise amounts. The dates labels on x-axis can be clicked to navigate to the detailed expense vs revenues information for the period ending on that date.
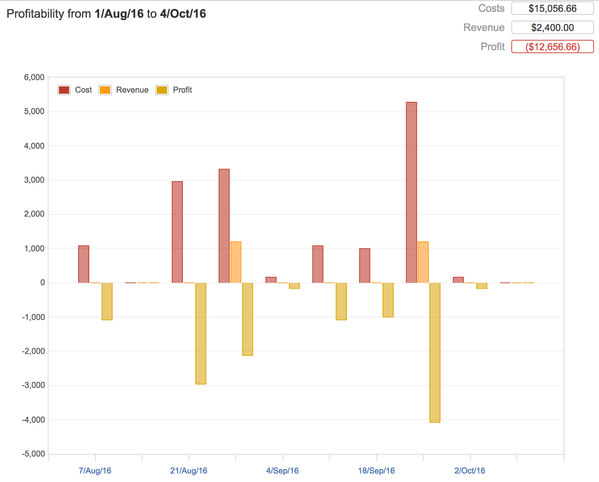
Profitability chart
Detailed information for all periods follow the chart. Each of these sections shows the list of expenses and revenues, ordered alphabetically and grouped by category (OPEX, CAPEX or FINEX for expenses; Consulting, Operating and Non-operating for revenues) and then by expense/revenue types (or roles). The profit for that period appears in a lozenge in the heading on the right. A green lozenge indicates profit (revenue ≥ expenses) and a red lozenge indicates losses (revenue < expenses).
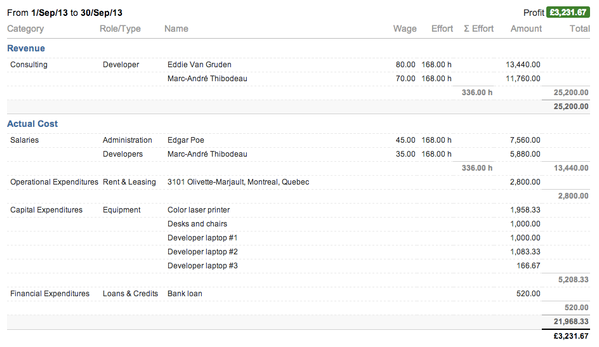
Detailed period section
Configuring the report
To change the period covered by the report, simply set the dates in the 'From' and 'To' fields to whatever dates you want. The actual period considered will span from the latest of folio's start date and the date entered in "From" field (expenses and revenues defined to occur before the folio start won't be taken into account). You can specify which frequency the report should use to break down the overall period. For example, selecting Monthly frequency will show you revenues and expenses broke down by calendar months. Select "Total" value in the Frequency to get earned value and all expenses for the complete period, with no break down. You can finally limit the revenues and expenses considered to a certain number of types and/or position roles. Simply select/deselect the expense types you are interested in and the report will be instantly refreshed to reflect the new selection. Selecting or deselecting a category will cause the list of available expense types and position roles to be updated accordingly. See the table below for detailed information about report parameters.
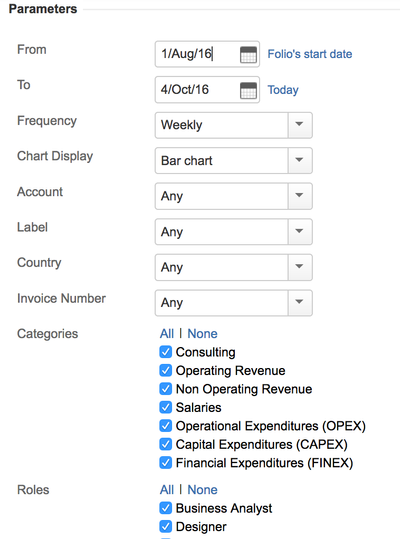
Report parameters
| From | Start of the time frame for that report. |
|---|---|
| To | End of the time frame for that report. Notes:
|
| Display Results by | This allows you to break down the information by week, 2 weeks, 4 weeks, Quarter, Calendar Year, or Fiscal Year. Total means no breakdown will occur; all issues for the selected period will be included in a single section. Note that report start date "day" will be the periods starting day. This means if your report start date is a Tuesday and the frequency is Weekly the report will display weekly expenses from Tuesday to next Monday. |
| Chart Display | The Chart display options
|
| Account | This allows you to display amounts of all expenses/revenues and worklogs of issues link to the selected account. |
| Labels | This allows you to display amounts for the selected Jira Issue Label. (not available at the portfolio level) Note : see Using Labels for more info on. |
| Custom fields | All custom fields of the type SELECT and TEXT will be added as parameters. The options will be based on the values used by the folio items. This allows you to display amounts for the selected custom field values. |
| Categories | Expense and revenue categories to be taken into account in the report. |
| Roles | Position roles to be taken into account in the report |
| Types | Expense types to be taken into account in the report |
Profitability report parameters details
Printing the report
Selecting the "Printable" item in the report's action menu found at the top right of the report's parameters panel to get a printer-friendly version of the report.
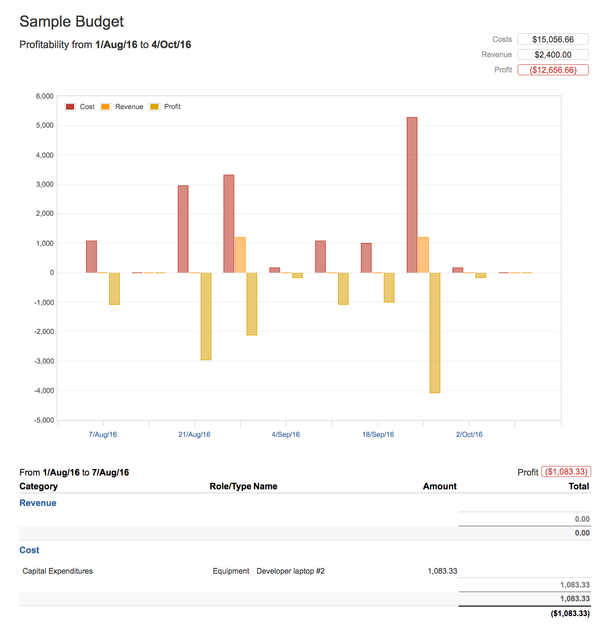
Printable version of the report
Exporting to Excel
The Profitability report can be exported to Excel format to give you all the latitude you need to further digest, analyze or graph the data. Do it by selecting the "Export to Excel" item in the report's action menu found at the top right of the report's parameters panel. The parameters that were used to generate the report can be found on the second tab of the generated spreadsheet
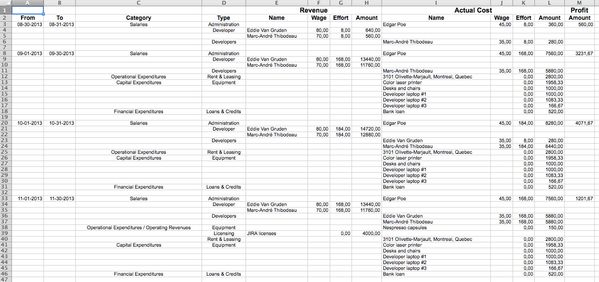
Excel export of the report
Related pages:
Tempo for Server Documentation
For the newest versions of Tempo documentation, please visit our Help Center. For support, see our Support Portal.