Portfolio Costs
The Portfolio Costs tab lets you plan your project expenses, track them during project execution and obtain future costs forecasts based on your current team's performance. Navigate between Summary and Forecast using the second tab level that appears just below the header when the Costs tab is selected.
Viewing the Portfolio Costs Summary
The Porfolio Cost Summary tab provides you with an overview of the current states of this portfolio's costs.
It is divided into four sections: Traffic Light Indicator and Summary, Distribution of Total Planned Costs, Distribution of Costs to Date and Notes.

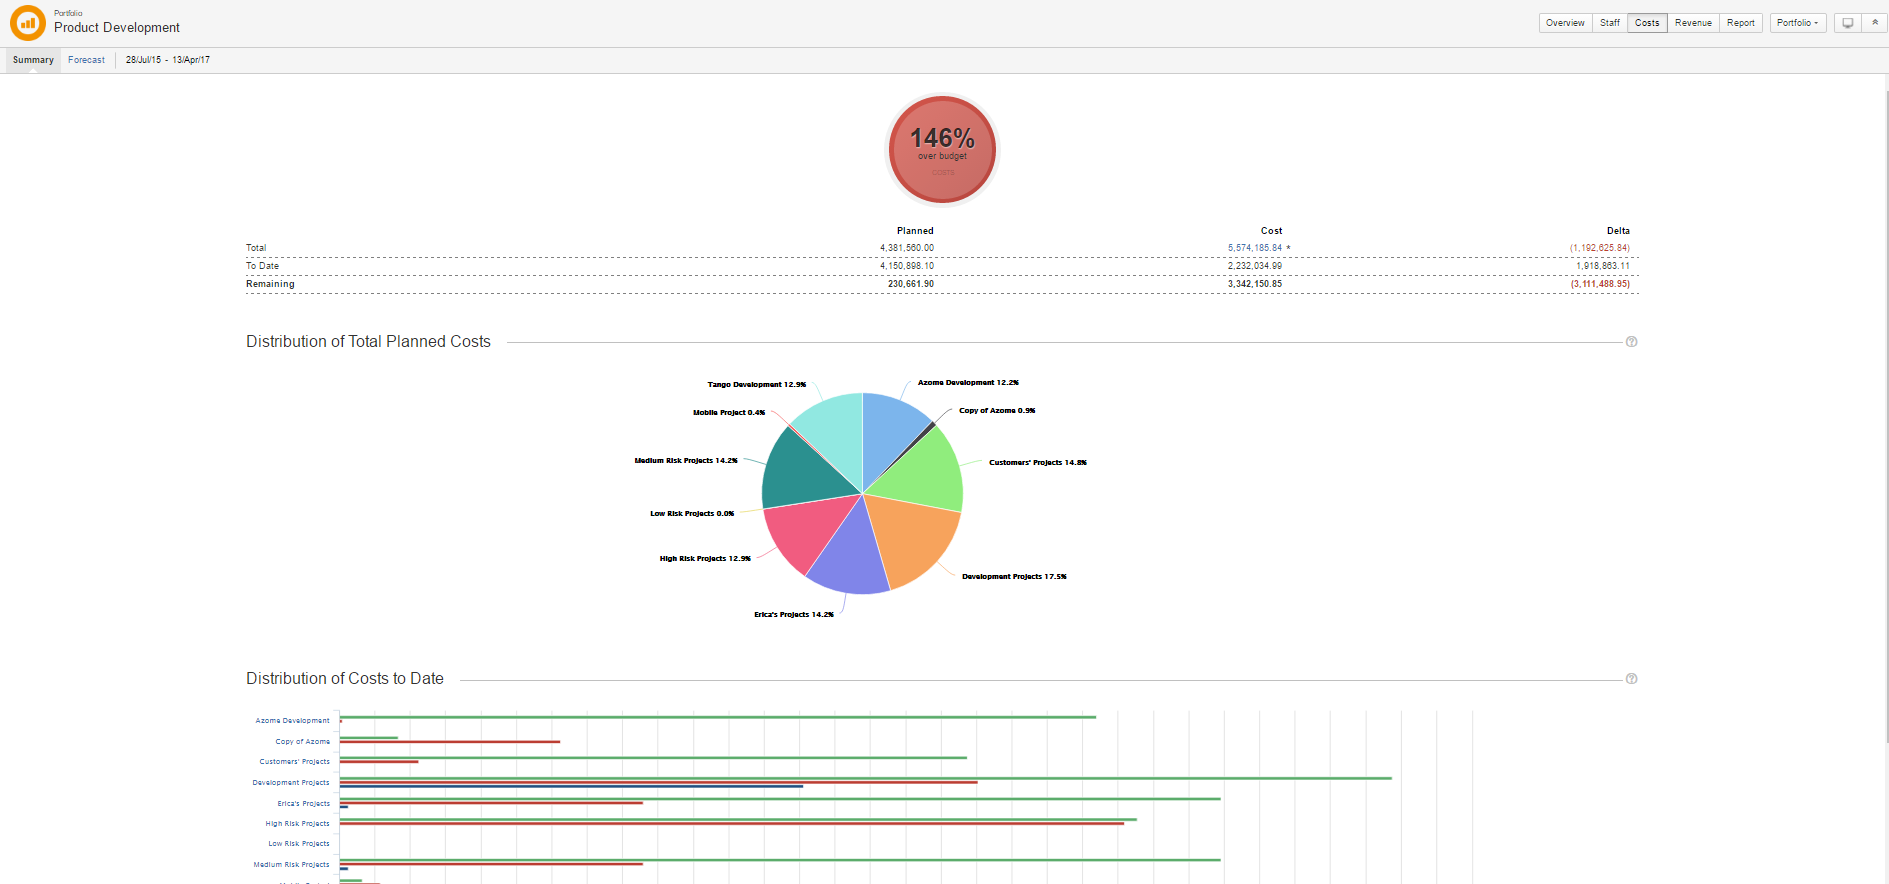
Traffic Light Indicator and Summary
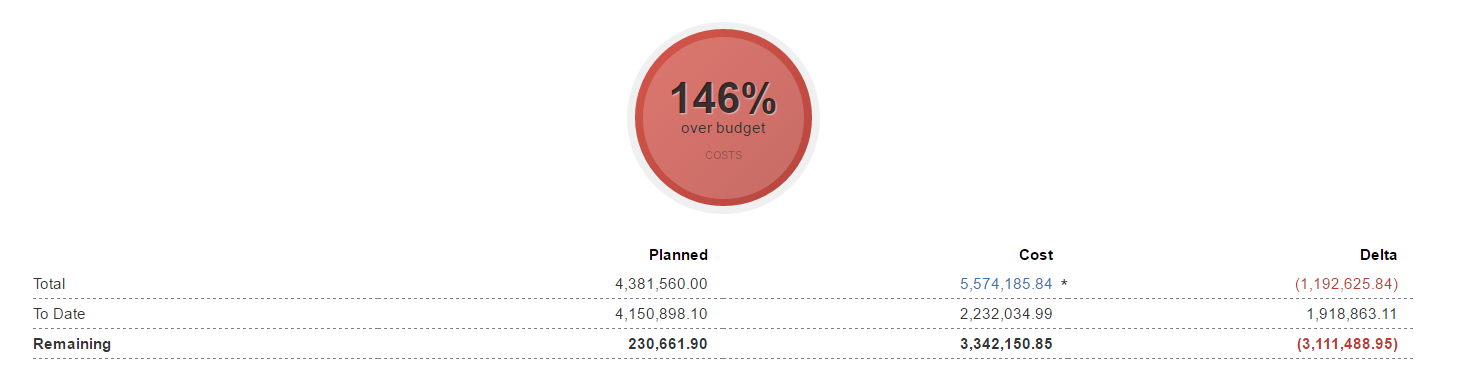
This section provides you with an at a glance view of the portfolio's costs. The system uses the following color schemes to indicate statuses:
- Green: On track. All aspects of portfolio costs are within tolerance.
- Amber: Some issues are having a negative effect on the portfolio's costs. Viability is at risk
- Red: Problematic. Serious, high-risk concerns are threatening the overall performance of the portfolio.
- Grey: No data available for the time being.
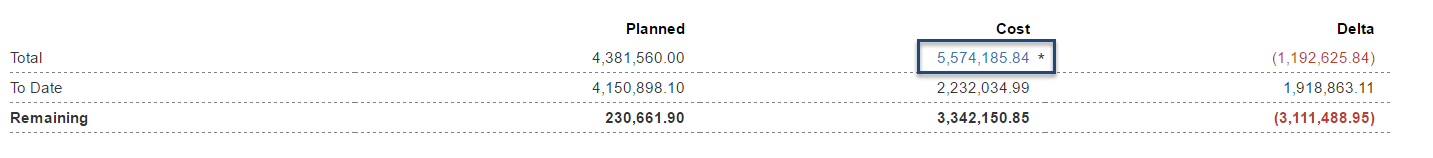
You can click the values in the Cost column of the Summary section to obtain more information:
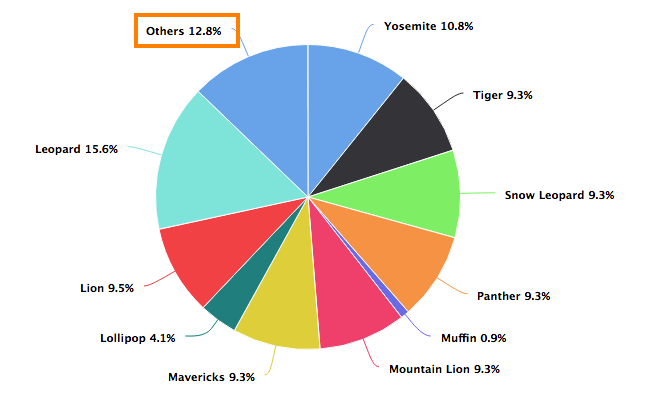
Distribution of Total Planned Costs
This section displays a chart that indicates the weight of each folio in this portfolio in terms of budget.
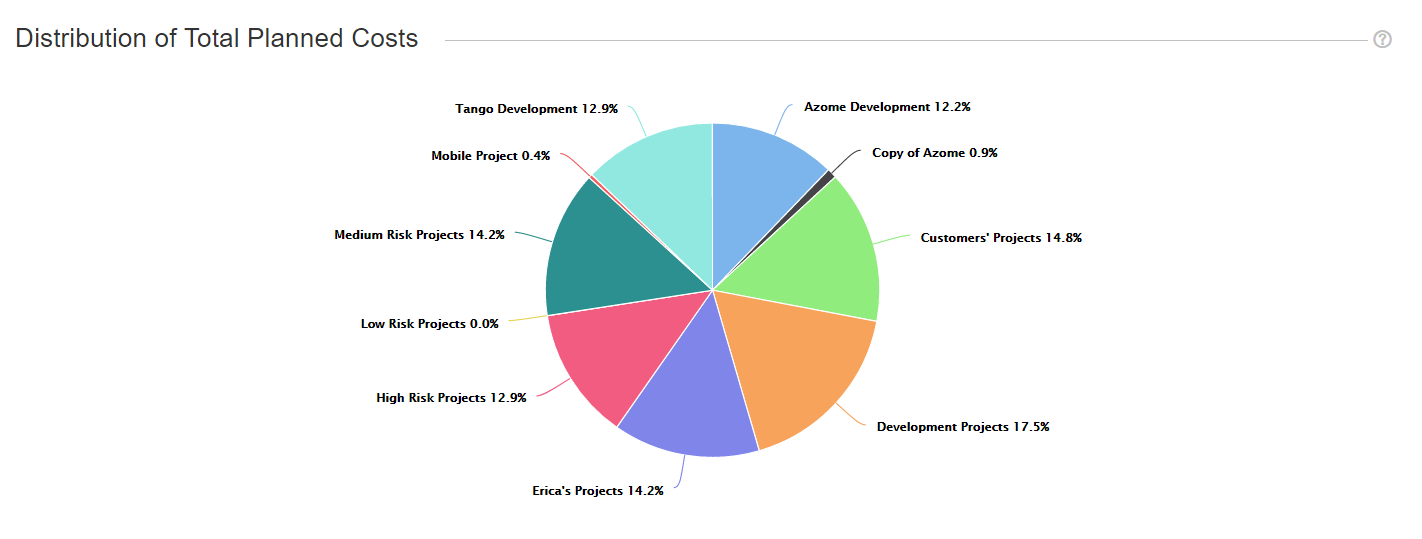
You can click the chart slices to navigate to the detailed budget of the corresponding folio. The chart will group smallest folios under "Others" if the portfolio contains more than 10 folios.
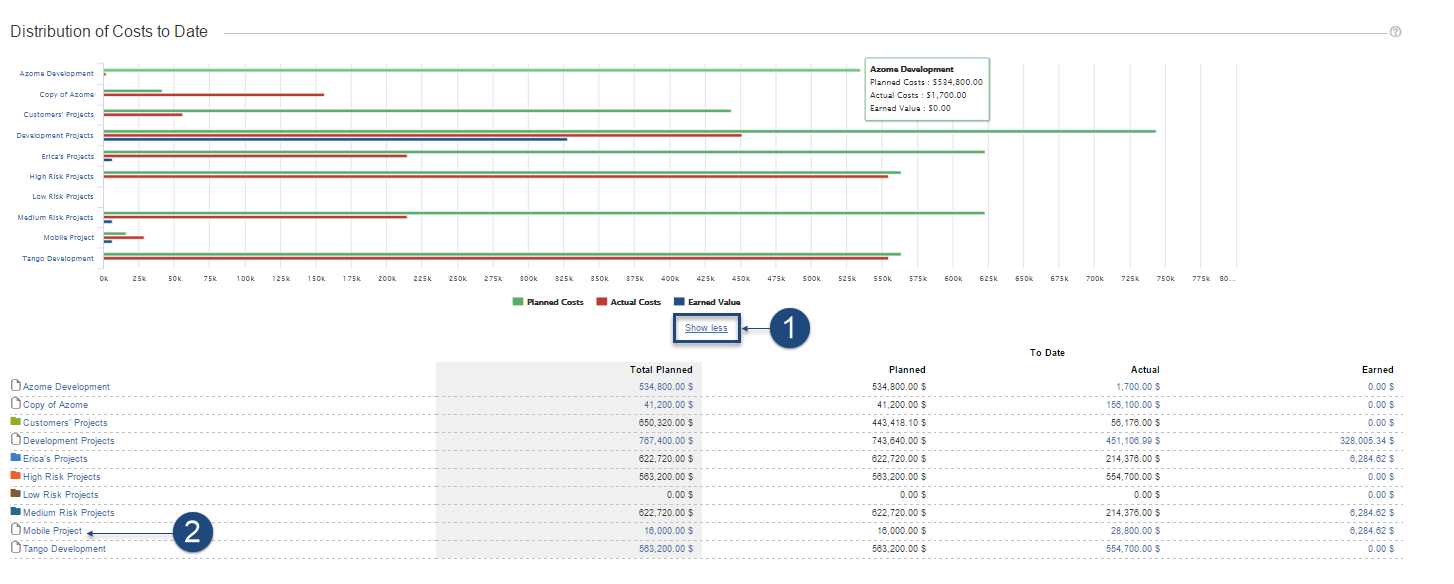
Distribution of Costs to Date
This section displays a chart that puts in contrast each folio in terms of actual costs, planned costs and earned value (if applicable).
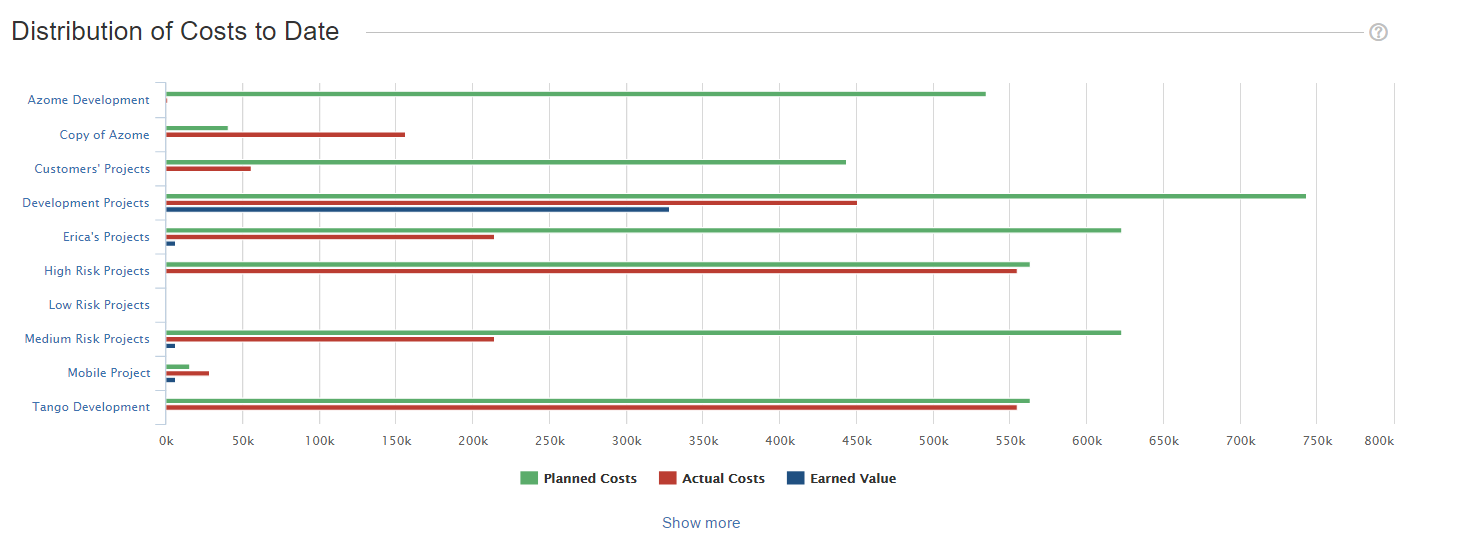
You can hover your cursor on the chart to obtain at a glance information on each folio.
1. Click the Show more/Show less link to display more information.
2. Click the folio in the list to go to its dashboard.
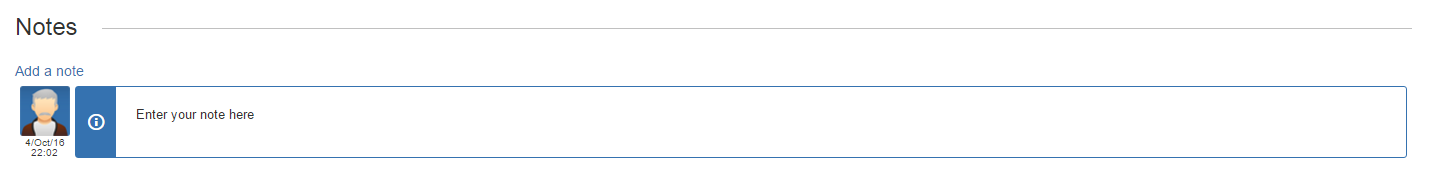
Notes
This section lets you add additional notes.

To do so:
1. Click the Add a note link.
2. Enter the note.
3. Select the Level (Information, warning, success, important).
4. Click the Add Note button.
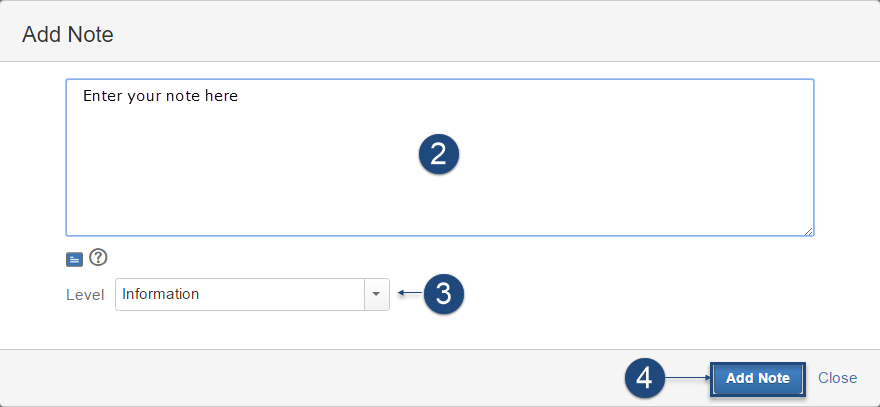
Your note will be added to the Portfolio.
Viewing the Portfolio Costs Forecast
The Forecast screen shows the evolution of the financial numbers of a Portfolio over time. It is divided in two parts:
A chart showing the Folio's or Portfolio's past and projected Planned, Actual and Earned Value (if EVM is on).
A details panel on the right side that displays more information about current and projected values.
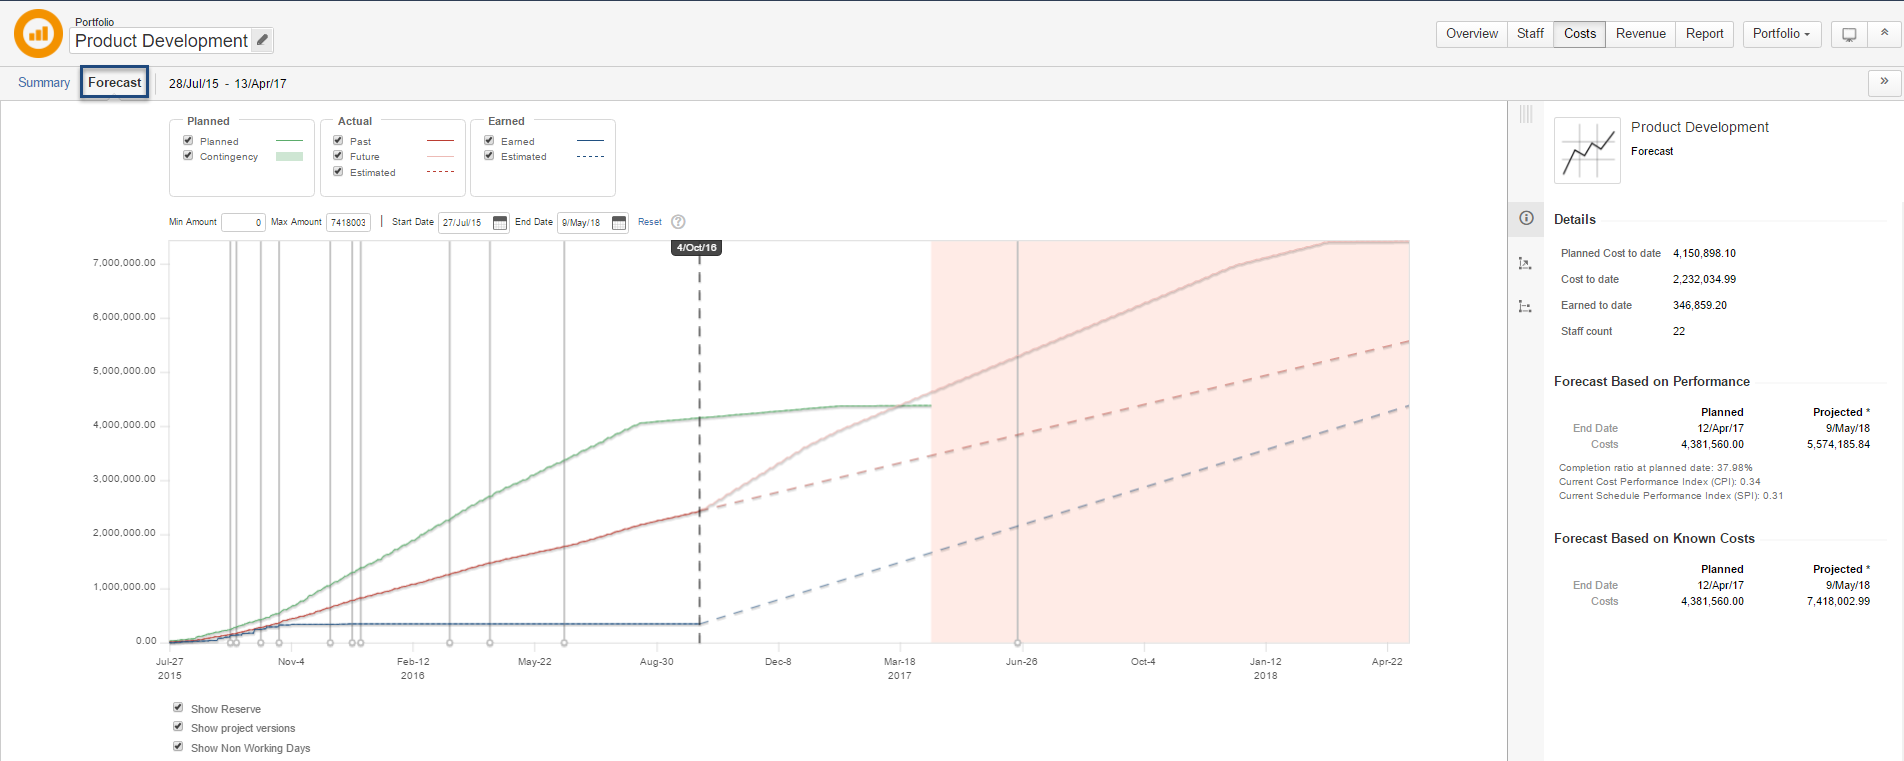
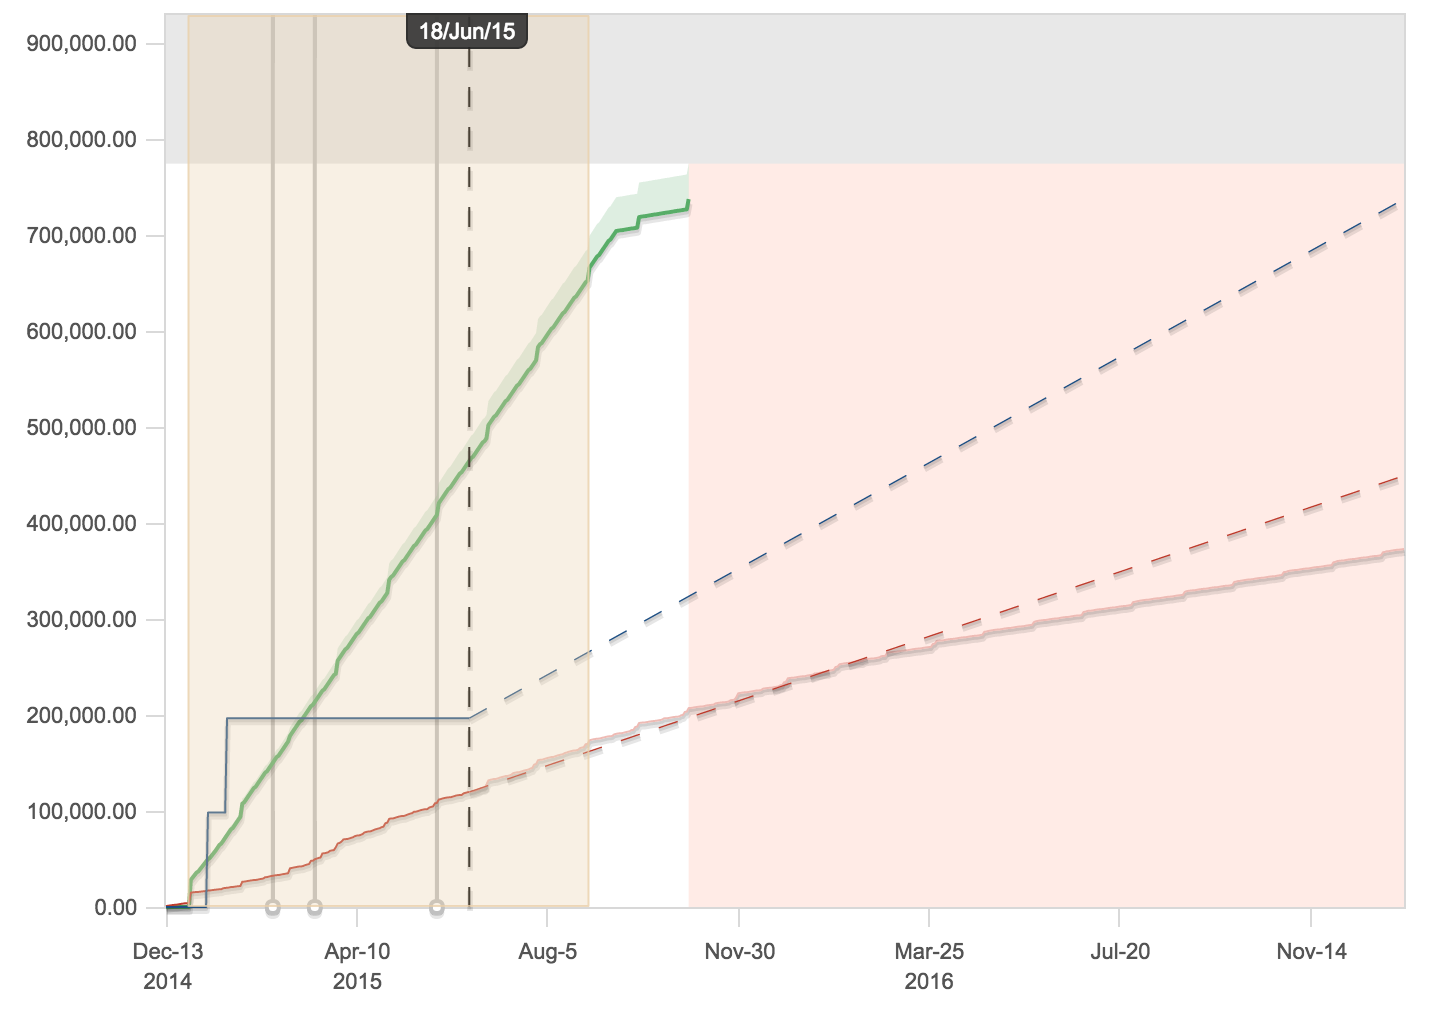
The Chart
The forecast chart displays various curves showing the evolution of financial numbers related to the current Folio or Portfolio. It spans on a period of time that covers the whole time frame of the Folio, plus possibly a "Behind Schedule" period. The "Behind Schedule" period (pale red area at the extreme right of the chart) appears if the current performance indices of the Folio lead to an estimated end date later than the current configured end date of the Folio. Note that in the case of a Folio without EVM, if it is configured to determine the completion ratio based on the project calendar progress, then the Folio will never be considered ahead or behind schedule. Today's date is indicated by a vertical dashed line. Clicking on any series of the chart brings up a tooltip that displays the detailed information at the selected point in time.
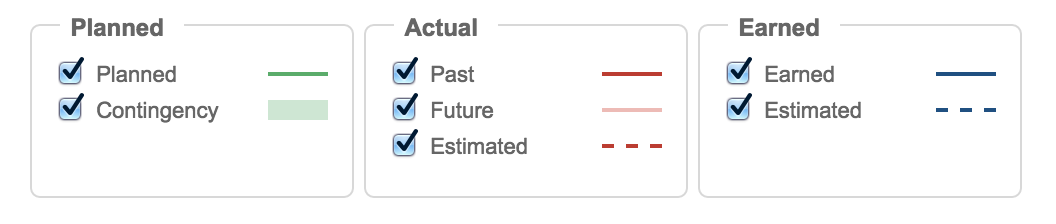
Curves
| Budget | ||
|---|---|---|
 | Planned | The Planned Value for the Folio or Portfolio time frame. If the budget has been approved, then this curve is determined by the expenses or revenues as they were when they were last approved. |
 | Contingency | The Contingency is an area spanning over the Planned Value curve if a contingency has been configured for the current Folio. The height of the Contingency area reflects the percentage configured (see Folio Configuration). |
| Earned | ||
 | Past | [EVM only] The evolution of the Earned Value of the Folio or Portfolio until today. |
 | Estimated | [EVM only] Future estimated Earned Value based on the Schedule Performance Index (see Health section of the Folio's Overview). |
Actual (when in Folio Costs page) | ||
 | Past | The actual costs that have been incurred by the Folio or Portfolio so far. |
 | Future | Future costs that are known to date (as they are entered in the Folio's Actual Costs) up to the projected end date. |
 | Estimated | Future estimated costs based on the Cost Performance Index (see Health section of the Folio's Overview). |
Actual (when in Folio Revenues page) | ||
 | Past | The actual revenues that have been generated by the Folio or Portfolio so far. |
 | Future | Future revenues that are known to date (as they are entered in the Folio's Actual Revenues) up to the projected end date. |
 | Estimated | Future estimated revenues based on the Cost Performance Index (see Health section of the Folio's Overview). |
| Actual Cost | The actual costs that have been incurred by the Folio or Portfolio so far. |
| Today | ||
 | Today's date. | |
Areas
The chart may display various coloured areas, depending on the Folio's configuration or current performance indices. These are described below.
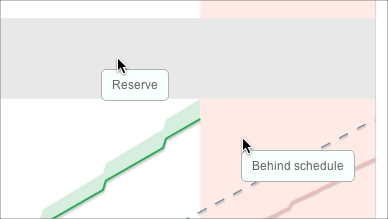
Reserve
The Reserve is an area sitting on top of total Planned Value and reflects the reserve percentage configured for the current Folio.
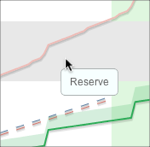
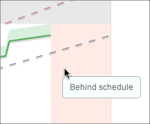
Behind schedule
The Behind schedule area appears if the current Schedule Performance Index of the Folio leads to an estimated completion date that is later than the Folio's planned end date. When displayed, the area sits at the extreme right of the chart, starting at the Folio's planned end date. Note that in the case of a Folio without EVM, if it is configured to determine the completion ratio based on the project calendar progress, then the Folio will never be considered behind schedule.
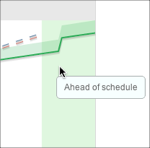
Ahead of schedule
The Ahead of schedule area appears if the current Schedule Performance Index of the Folio leads to an estimated completion date that is earlier than the Folio's planned end date. When displayed, the area sits at the extreme right of the chart, starting at the Folio's planned end date. Note that in the case of a Folio without EVM, if it is configured to determine the completion ratio based on the project calendar progress , then the Folio will never be considered ahead of schedule.
Point Selection Details
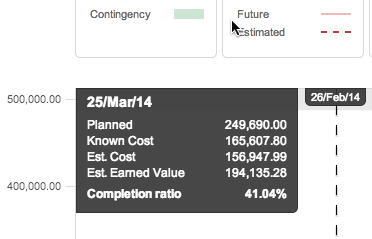
Clicking on a curve of the chart brings up a tooltip containing precise values at that particular point in time.
When a point is selected, you can navigate to the next data point by typing j or to the previous one by typing k.
| Point selected is today or before | Point selected is in the future |
|
|
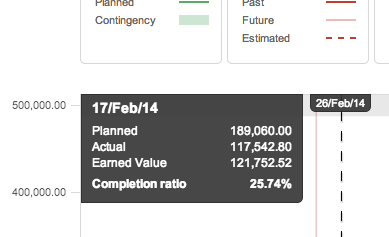
| Planned | Planned Value at the selected point in time. |
|---|---|
| Actual | Actual Value (Cost or Revenue) a at the selected point in time. |
Earned Value | [EVM only] Earned Value at the selected point in time. |
| Known Cost (or Known Revenue) | Known Cost (or Revenue) a at the selected point in time. |
| Est. Cost (or Est. Revenue) | Extrapolated Estimated Cost (or Revenue) at the selected point in time given current performance. |
| Est. Earned Value | [EVM only] Extrapolated Earned Value at the selected point in time given current performance. |
| Profit | [Revenue only] The profit earned at the selected point in time |
| Completion ratio | Actual (or estimated if selection is in the future) completion percentage of the project at a specific point in time. |
Show / Hide Curves
Checking/unchecking boxes located at the left of each curve in the legend of the chart allows to show/hide them in the forecast chart.
Show / Hide Non-Working Days
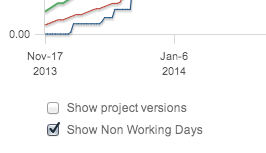
The Show Non Working Days option allows you to display weekend days and other configured non working days on the chart.
Show / Hide Project(s) Versions
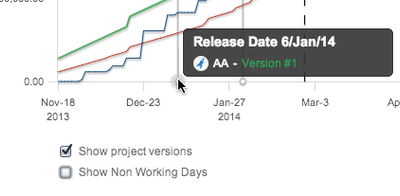
The Show Project Versions option allows you to display the project Versions you defined in JIRA. All versions from all projects included in the Folio's scope will be shown when the option is selected.
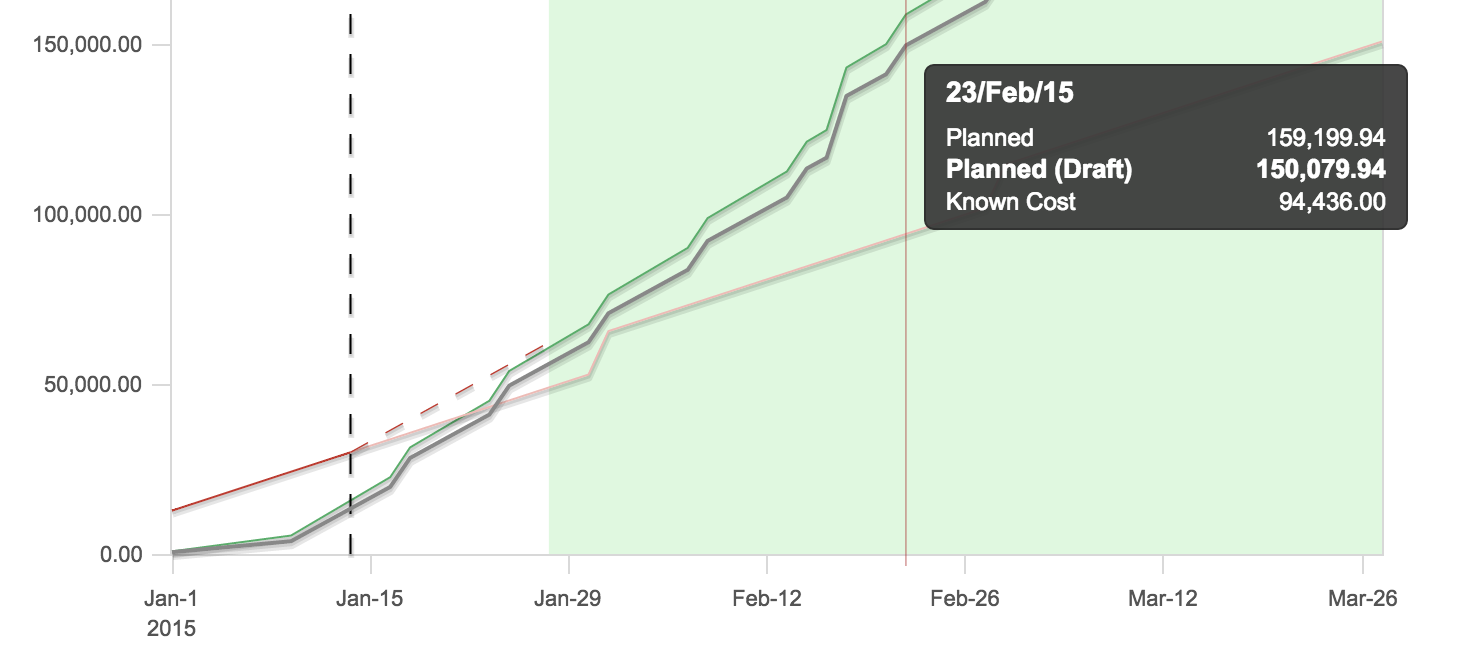
Show / Hide Draft
If the budget have been approved at least once, then you can choose to show the current budget draft on the forecast chart. The budget draft contains the latest version of unapproved changes to expenses and human resources (under the Planned sub-tab).
To display the current budget draft, check the Show Draft box located under the chart. Hide the budget draft by unchecking the box. The budget draft is displayed as a gray curve and its daily value can be viewed in the chart's tooltip by hovering or clicking any point on one of the curves.
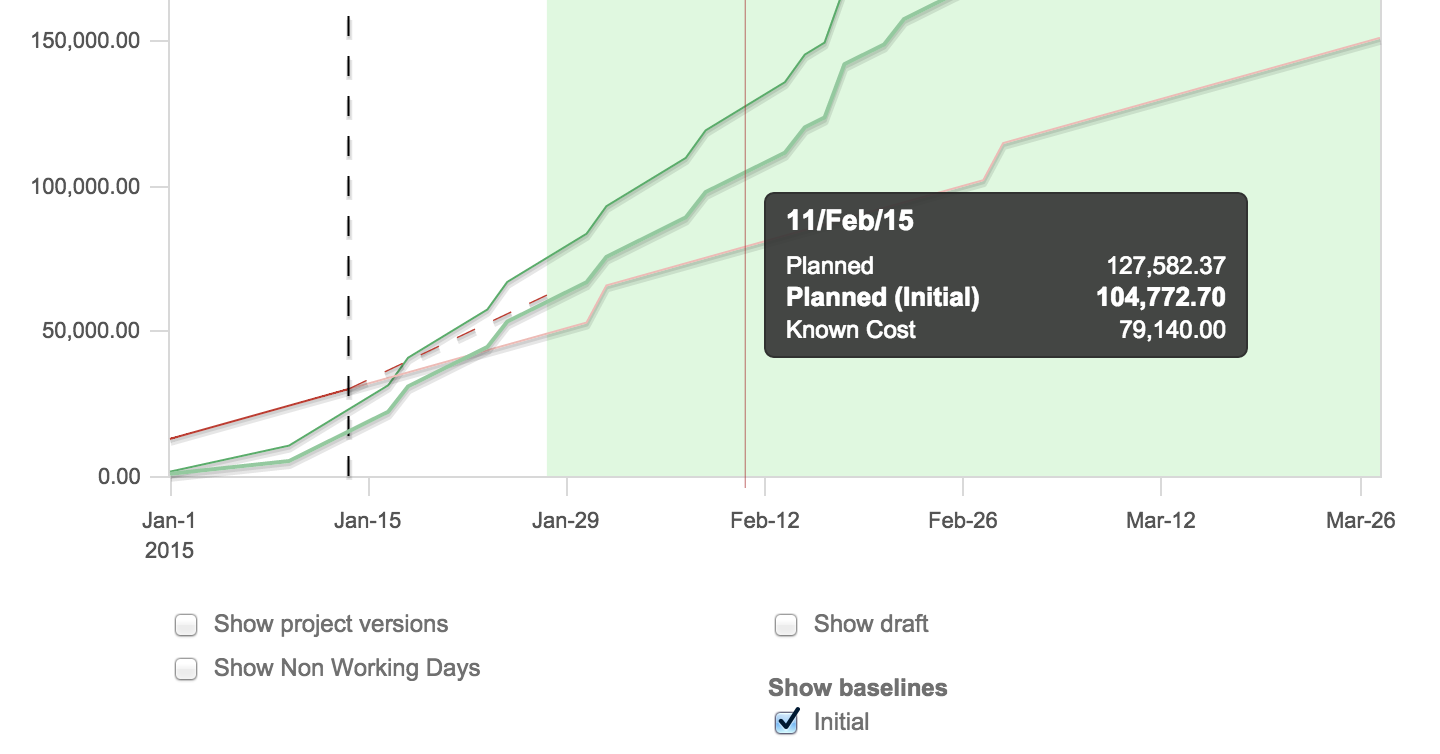
Show / Hide Previous Baselines
If the budget have been approved more than once, then you can choose to show one or more previous budget baselines on forecast chart.
To display a previous baseline, check the corresponding box located under the chart, under the Show baselines. You can select many baselines to display them simultaneously. Hide a baseline by unchecking it. Baselines are displayed as a green curves and their daily value can be viewed in the chart's tooltip by hovering or clicking any point on one of the curves.
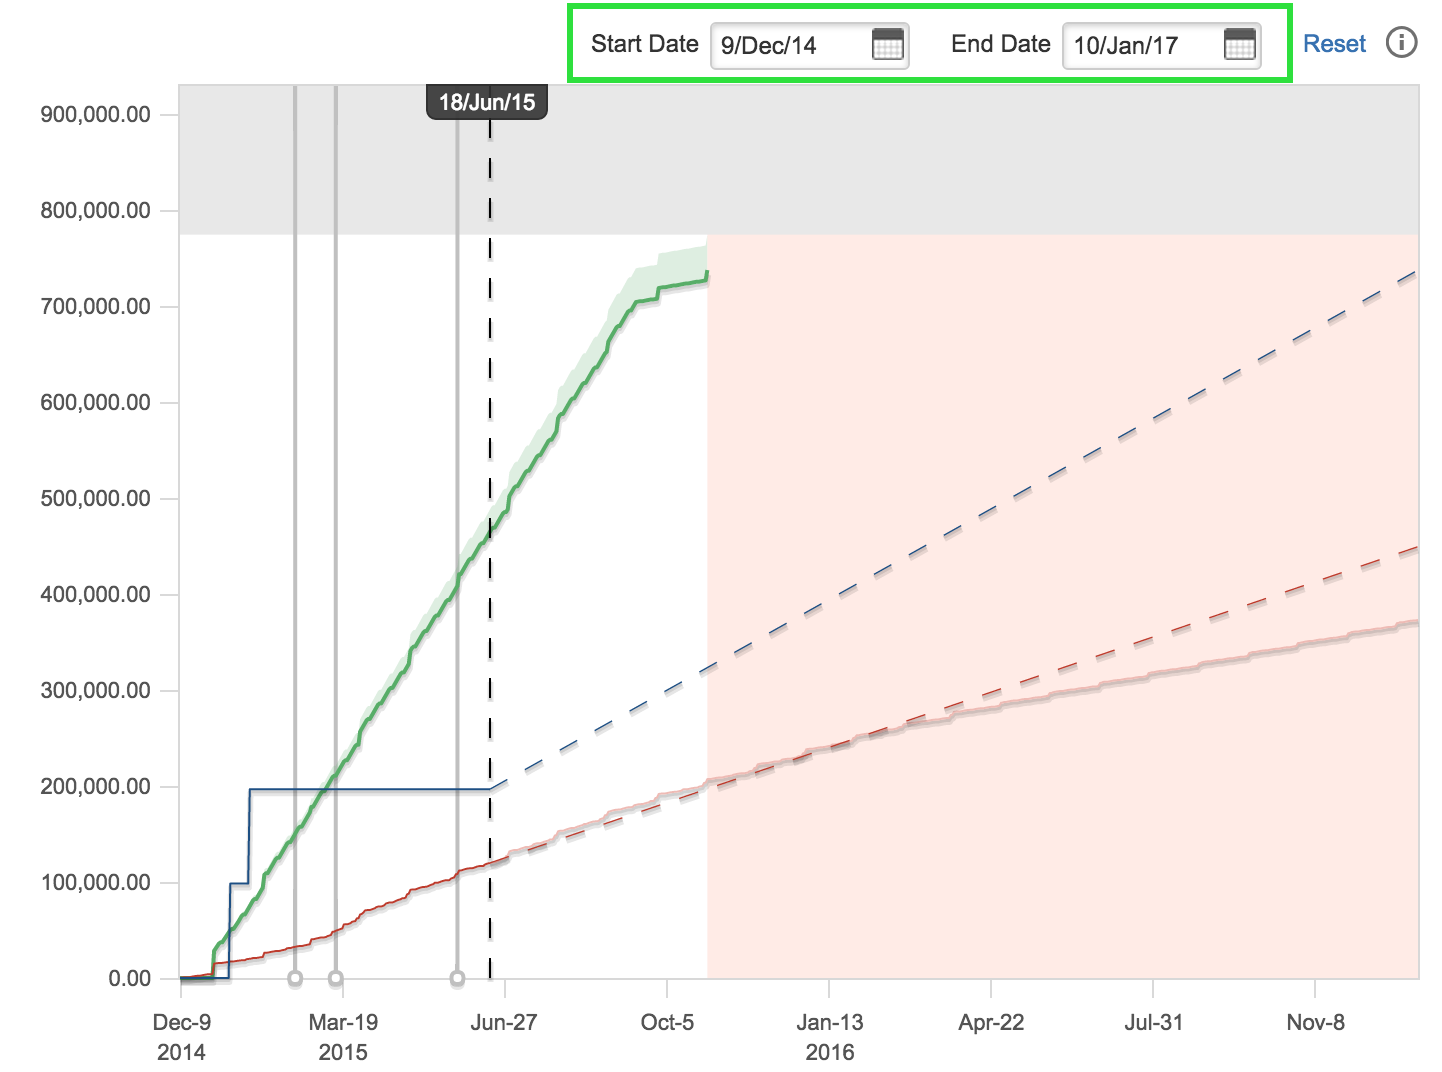
Zooming
If you are interested only in a small portion of the forecast chart, you can zoom into it in one of two ways: using date pickers or by clicking and dragging.
Zooming using Date Pickers
Use the date pickers located at the top right of the chart to select a period. The chart is updated as soon as you change one of the dates.
Zooming by clicking and dragging
You can zoom on a period by clicking anywhere on the chart, either at the beginning or end of the period your are interested in, and then dragging (holding the mouse button down and moving) towards the other end of the period. When you release the mouse button, the chart is updated to focus on the highlighted period.
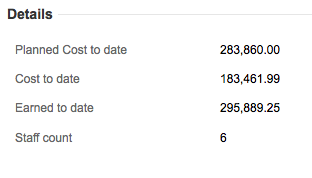
Forecast details
The Forecast details panel appears on the righthand side of the Forecast screen. It displays other financial details of interest.
Details
This section displays the Planned Value, Actual Value (Cost or Revenue) and Earned Value to date (if EVM is used). Is also shows the current staff count (the number of assigned positions as of today).
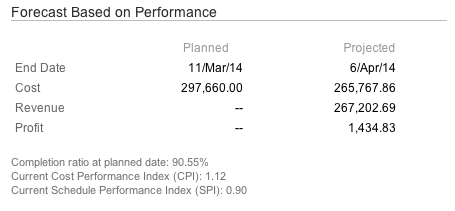
Forecast based on Performance
This section shows projections based on the past performance. It shows a comparison between planned and projected end dates as well as planned and projected total costs. When using EVM, performance is determined by indices, namely the Cost Performance Index (CPI) and Schedule Performance Index (SPI). When not using EVM, the performance is based on the current completion ratio and actual costs or revenues to date.
The Completion ratio at planned date gives the estimated completion percentage at the planned end date based on the current trend (CPI).
The Current Cost Performance Index (CPI) gives the value of the CPI used to estimate the projected cost.
The Current Schedule Performance Index (SPI) gives the value of the SPI used to estimate the projected end date.
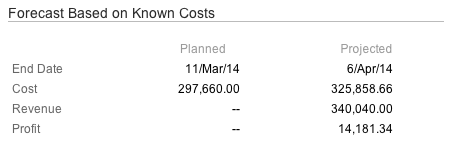
Forecast based on future known costs
This section shows projections based on future known costs (or revenues). It shows a comparison between planned and projected end dates as well as planned and projected total costs (or revenues) based on future known costs (or revenues) .
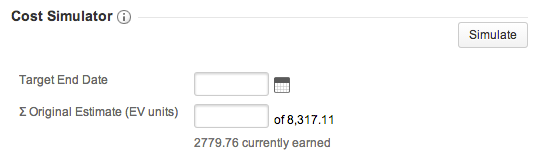
Cost Simulator
[Available for Costs only] The Cost Simulator allows you to perform some simulations in order to get estimates, for instance, on the staff count that would be required to attain a certain Earned Value.
Tempo for Server Documentation
For the newest versions of Tempo documentation, please visit our Help Center. For support, see our Support Portal.