Planned Time by Team
This is a child page of Tempo Gadgets, explaining the Planned Time by Team gadget. This gadget displays planned and unplanned time in the future for a given team.
For this gadget to be available, the following check box must be selected in Global Configuration:
'Users with Plan Time permission for a team can plan time for team members in Tempo Timesheets'
This gadget is great for Team Leads and Executives to track overall planned time from a current date.
Required permission
Approve Timesheet permission
Configuration
Use a Dashboards' Add Gadget button to add this gadget, but it is both explained on the parent page and in the JIRA documentation. The table below lists the configuration options, for each field or drop-down list in the gadget.
Default Configuration for the Team Time by Team gadget
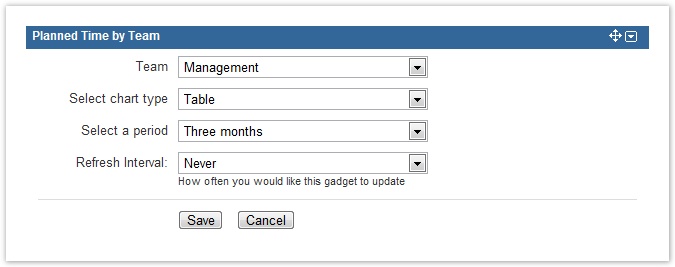
Table: Configuration options for each entry or field
Configuration Entry | Available Options |
|---|---|
| Team | All teams that the current user has Approve Timesheet permission for. |
| Select chart type | The available types are: Area Chart, Column Chart, Pie Chart with Numbers, Pie Chart with Percentages or Table. |
| Select a period | All the options start with the current date for each period. The options are One week, Two weeks, Three weeks, One month, Two months or Three months. |
| Refresh Interval | The values are Never, Every 15 Minutes, Every 30 Minutes, Every 1 hour or Every 2 hours.
|
When all the configuration options have been set, click the Save button to display the results in a graph - see screenshots below.
Gadget display
Examples of data displayed in this gadget are given below. Hover over the items on the charts to see more detail.
Column Chart with Planned time for the Web Development team
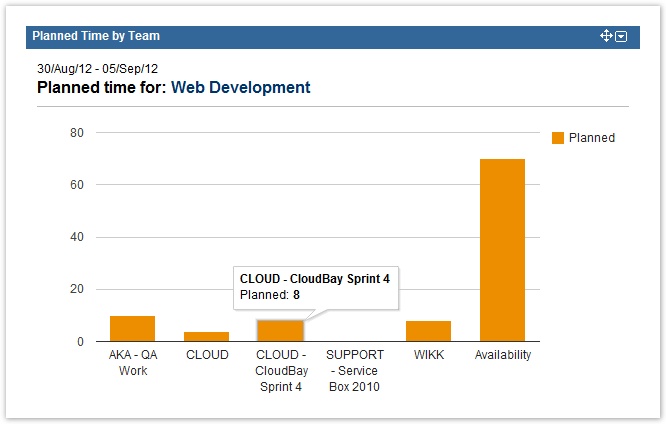
![]() The team name is an active link to the Team Timesheet for the selected team.
The team name is an active link to the Team Timesheet for the selected team.
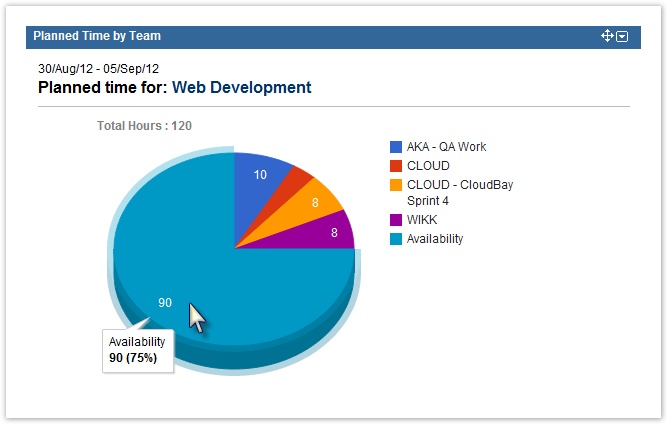
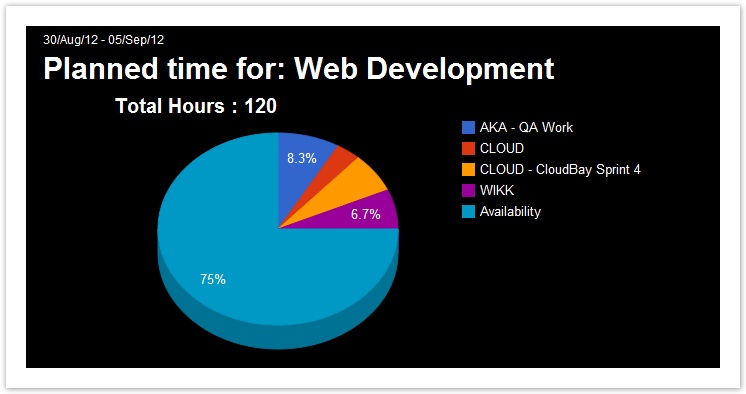
Pie Chart with Numbers for the Web Development team and its planned time
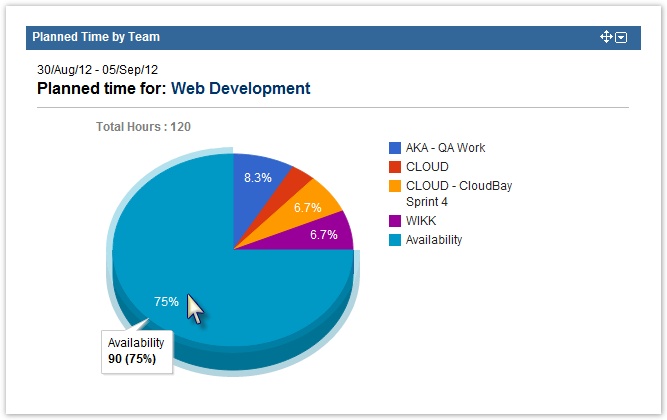
Pie Chart with Percentages for the Web Development team and its planned time
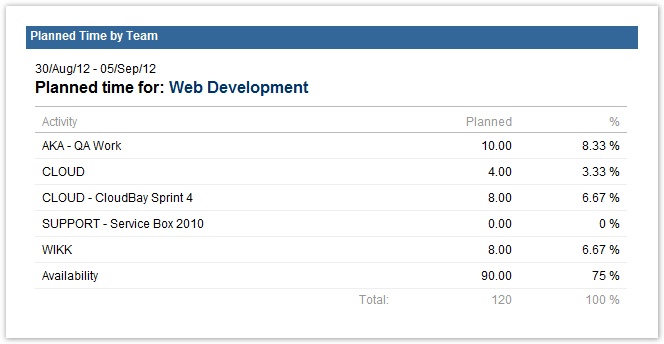
Same data as above in a Table, for the Web Development team and its planned time
Same data shown on Area Chart, for the Web Development team and its planned time
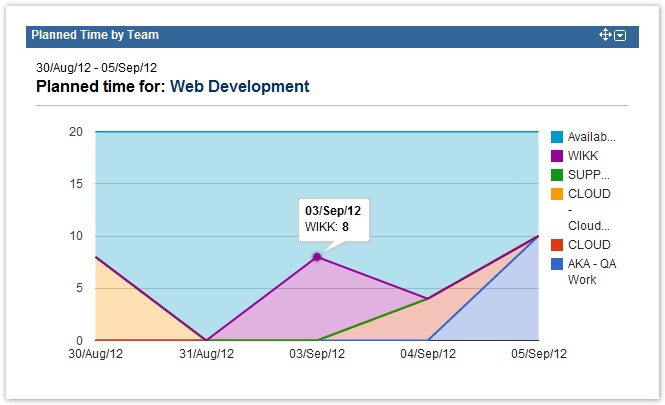
![]() Note that the Area Chart is a great view for the Lead of the team, to see when the team's resources are available for new projects.
Note that the Area Chart is a great view for the Lead of the team, to see when the team's resources are available for new projects.
The gadget can also be displayed on a JIRA Wallboard, given the plugin is installed.
Same data as above, but on a JIRA Wallboard
Tempo Timesheets for Server Documentation
For the newest version Tempo Timesheets documentation, please visit our Help Center. For support, see our Support Portal.