User Timesheet Charts
This is a child page of Tempo Gadgets, explaining the User Timesheet Charts gadget. This gadget displays the current user's logged hours within the current period.
![]() The User Name is an active link to the User timesheet.
The User Name is an active link to the User timesheet.
Configuration
Use a Dashboards' Add Gadget button to add this gadget, but it is both explained on the parent page and in the JIRA documentation. The table below lists the configuration options, for each field or drop-down list in the gadget.
Default Configuration for the User Timesheet Charts gadget
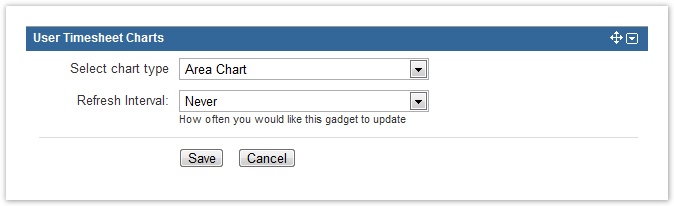
Table: Configuration options for each entry or field
Configuration Entry | Available Options |
|---|---|
| Select chart type | Available charts are Area Chart, Column Chart, Pie Chart with Numbers or Pie Chart with Percentages. |
| Refresh Interval | The values are Never, Every 15 Minutes, Every 30 Minutes, Every 1 hour or Every 2 hours.
|
When all the configuration options have been set, click the Save button to display the results in a graph - see screenshots below.
Gadget display
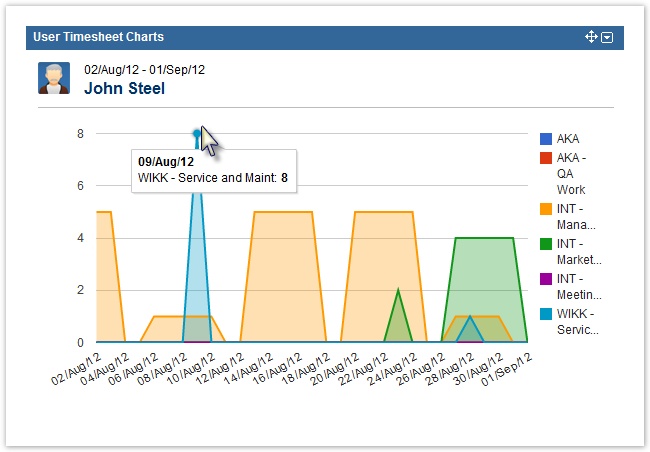
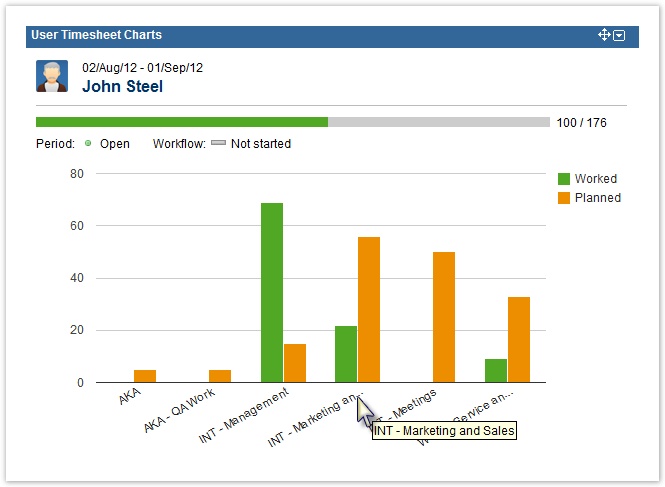
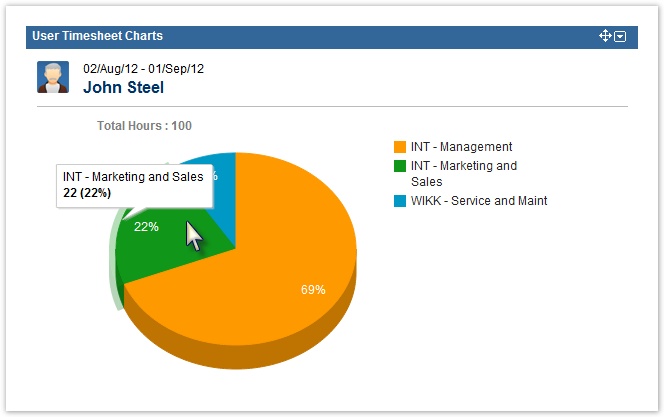
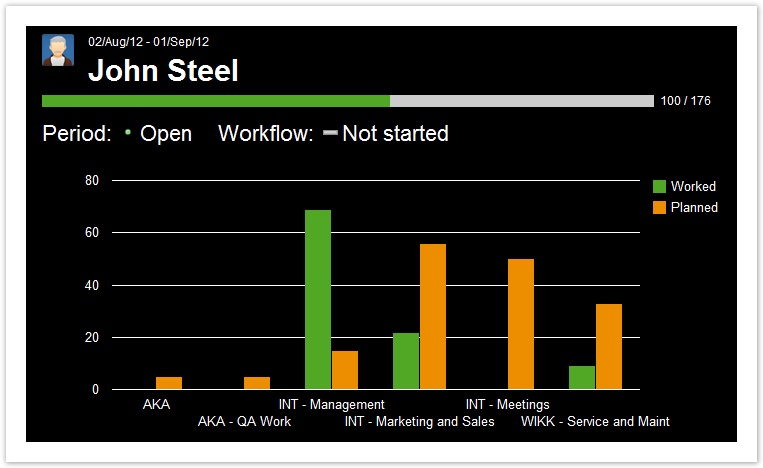
Examples of data displayed in this gadget are given below. Hover over the items on the charts to see more detail.
Area Chart for John Steel
Column Chart for John Steel
Pie Chart with Numbers for John Steel
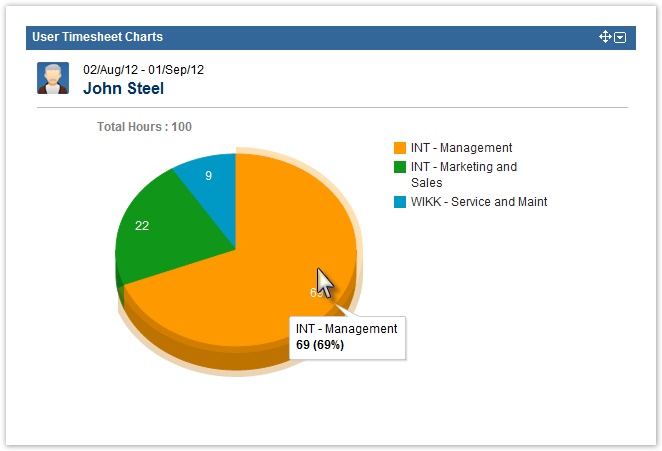
Pie Chart with Percentages for John Steel
The gadget can also be displayed on a JIRA Wallboard, given the plugin is installed.
Same data as above, but on a JIRA Wallboard
Tempo Timesheets for Server Documentation
For the newest version Tempo Timesheets documentation, please visit our Help Center. For support, see our Support Portal.