Worklog Distribution Gadget
This page explains the Worklog Distribution Gadget. It is as the name indicates, good to analyse or get an overview for worklog distribution.
To view other users' contributions to the gadget results, you must have View All Worklogs permission for the JIRA Projects in the filter that is used.
Add Gadget to Dashboard
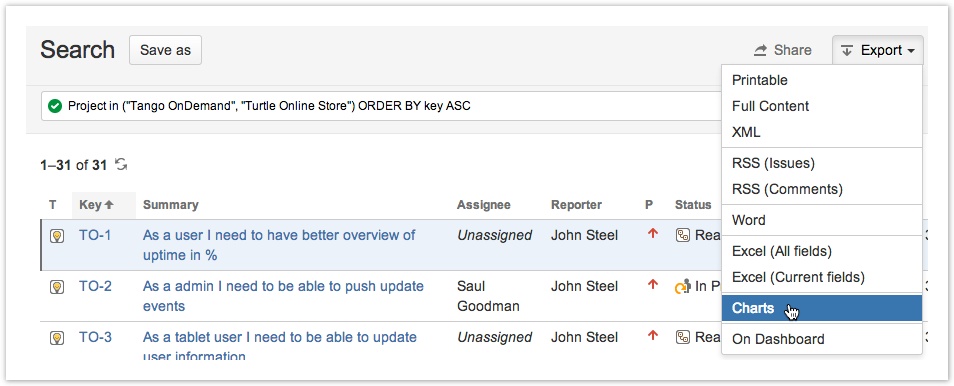
This gadget can be added in a few different ways to a dashboard. The Add Gadget button is both explained on the parent page and in the JIRA documentation. The gadget can also be added from the search JIRA Issue result screen, with an existing filter and by creating one on the fly through the process. This gadget can not be used in Confluence.
Exporting a search result to Charts (Gadget; click to enlarge)
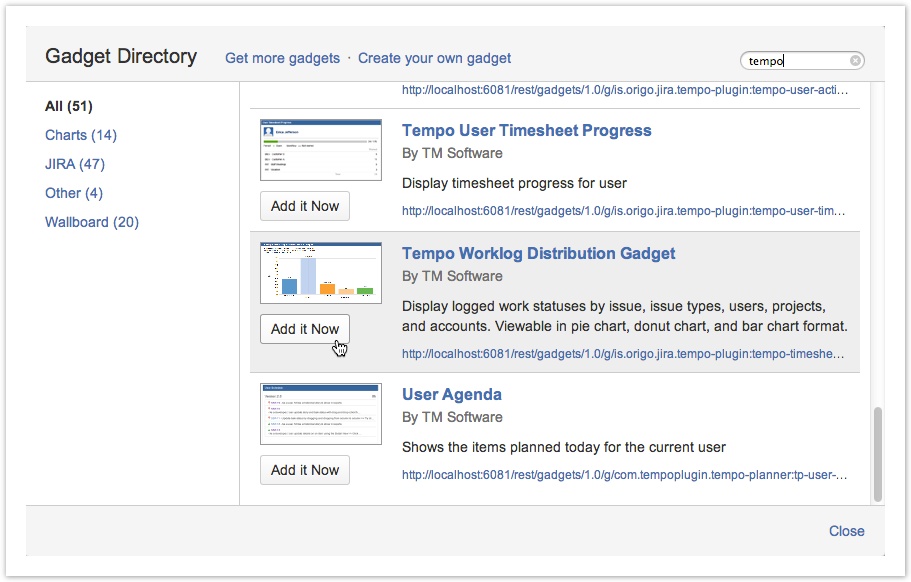
This opens the Gadget Directory, where you can choose the Worklog Distribution Gadget by using tempo keyword.
Adding the Tempo Worklog Distribution Gadget (click to enlarge)
Gadget Configuration
The screenshot below shows the default configuration for the Worklog Distribution Gadget, when it has just been added to a dashboard and a Filter has not been chosen. The table below lists the configuration options, for each drop-down list in the gadget.
Default Configuration for the Worklog Distribution Gadget
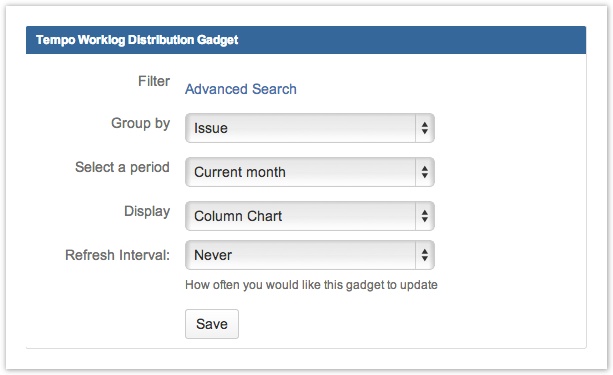
Table: Configuration options for each entry or field
| Configuration Entry | Available Options |
|---|---|
| Group by | Issue, Issue Type, User, Project, Account, Epic or Sprint |
| Select a period | Current month, Last month, Current week, Last week, Last 30 days or Last 90 days |
| Display | Column, Pie or Donut Chart |
| Refresh Interval | Never, Every 15 Minutes, Every 30 Minutes, Every 1 Hour or Every 2 Hours |
When all the configuration options have been set, click the Save button to display the results in a Column, Pie or Donut Chart - see screenshots below.
Gadget Display
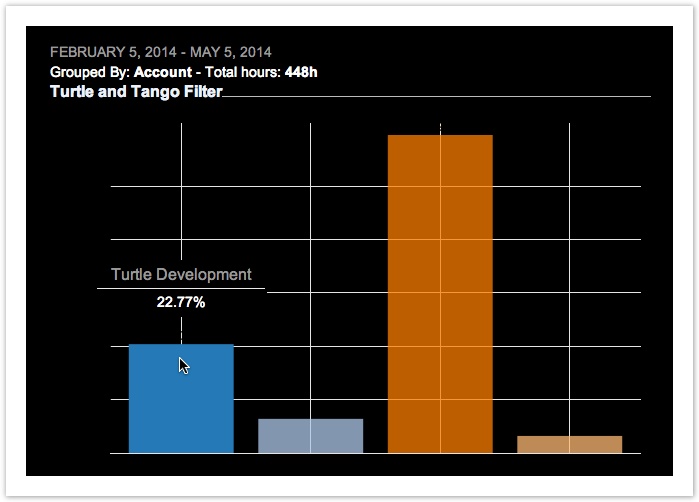
Several examples are given below, all with Group by Account, the period as the Last 90 days and displayed as one of the three charts available.
Configured as Group by Account, Last 90 days and displayed as Column Chart
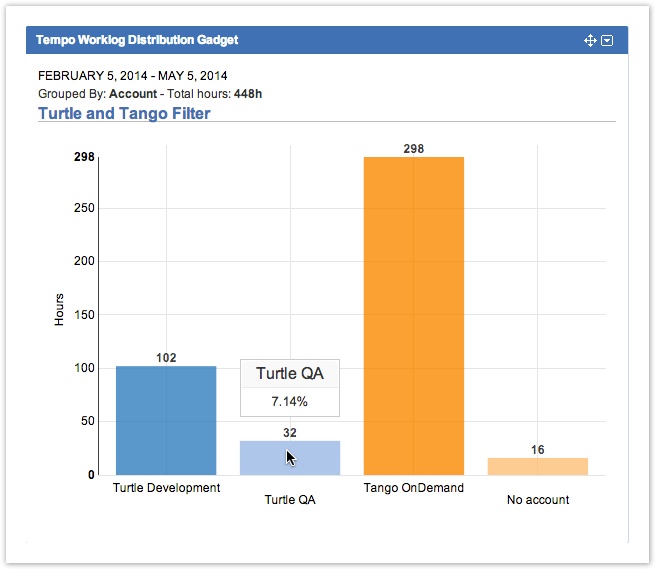
![]() The filter name is an active link, which opens the Advanced Timesheet for the filter displayed.
The filter name is an active link, which opens the Advanced Timesheet for the filter displayed.
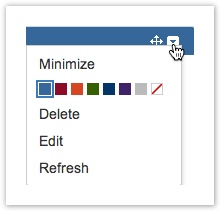
To edit any of the configuration options, open the gadget menu in the top right corner and click the Edit option. This opens the configuration screen as above, where the options can be edited as needed and then saved for a new display.
Edit option in the gadget menu
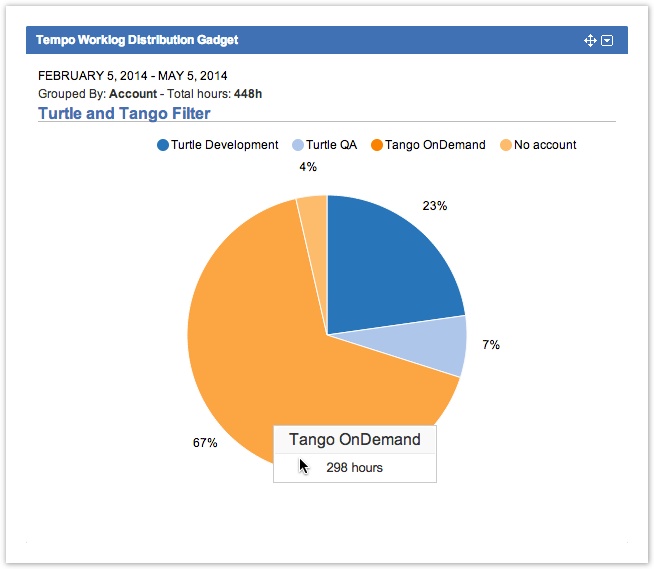
Same data as above, but in a Pie Chart
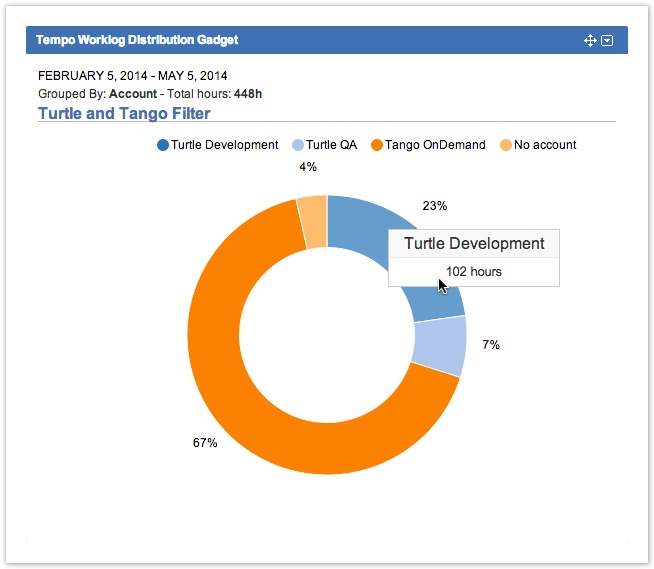
Same data as above, but now in a Donut Chart
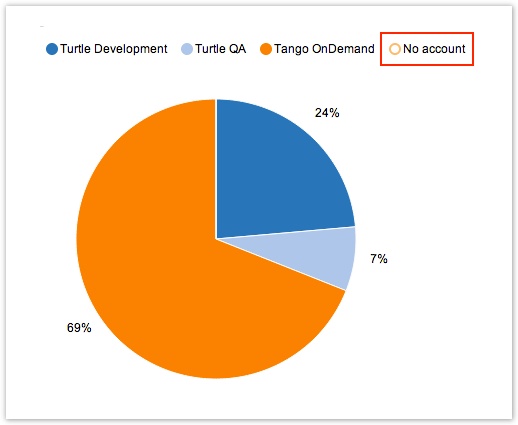
Values can be knocked out, both for the Pie and Donut Chart. To knock a value out, click on it's coloured circle and it is no longer included in the displayed image. To include it again, simply click on the dot again. The percentage displayed for each value, is always based on the total number of values included.
Pie Chart with the 'No account' option not displayed
The gadget can also be displayed on a JIRA Wallboard, given the plugin is installed.
Same data as above, but on a JIRA Wallboard
Tempo Timesheets for Server Documentation
For the newest version Tempo Timesheets documentation, please visit our Help Center. For support, see our Support Portal.