For each team, you can view a team utilization report, which consists of a bar chart and table that show the number of logged hours by account type (billable, capitalized, internal, operational).
Required permission
- Tempo Time-Tracking permission
- Browse Team permission for the team
- One of the following roles or permission types:
| Role or permission type | Included in the report |
|---|---|
| Team lead, or Approve Timesheet View All Worklogs permission for the team's projects | Logged hours of each team member |
| Team member | Your logged hours |
| Tempo Project Managers role | Hours that team members logged to the projects that you manage |
No report is displayed for periods in which there are no logged hours to be displayed.
Tutorial
Team utilization reporting
Widget Connector url https://www.youtube.com/watch?v=f1EIR6dNBUk&feature=youtu.be
Viewing the team utilization report
Procedure
To view the utilization report for a team, complete the following steps:
- On the main menu bar, click Tempo > TEAMS more.
- On the Teams page, click the name of the team.
- On the individual team page, in the upper-right corner, click Utilization.
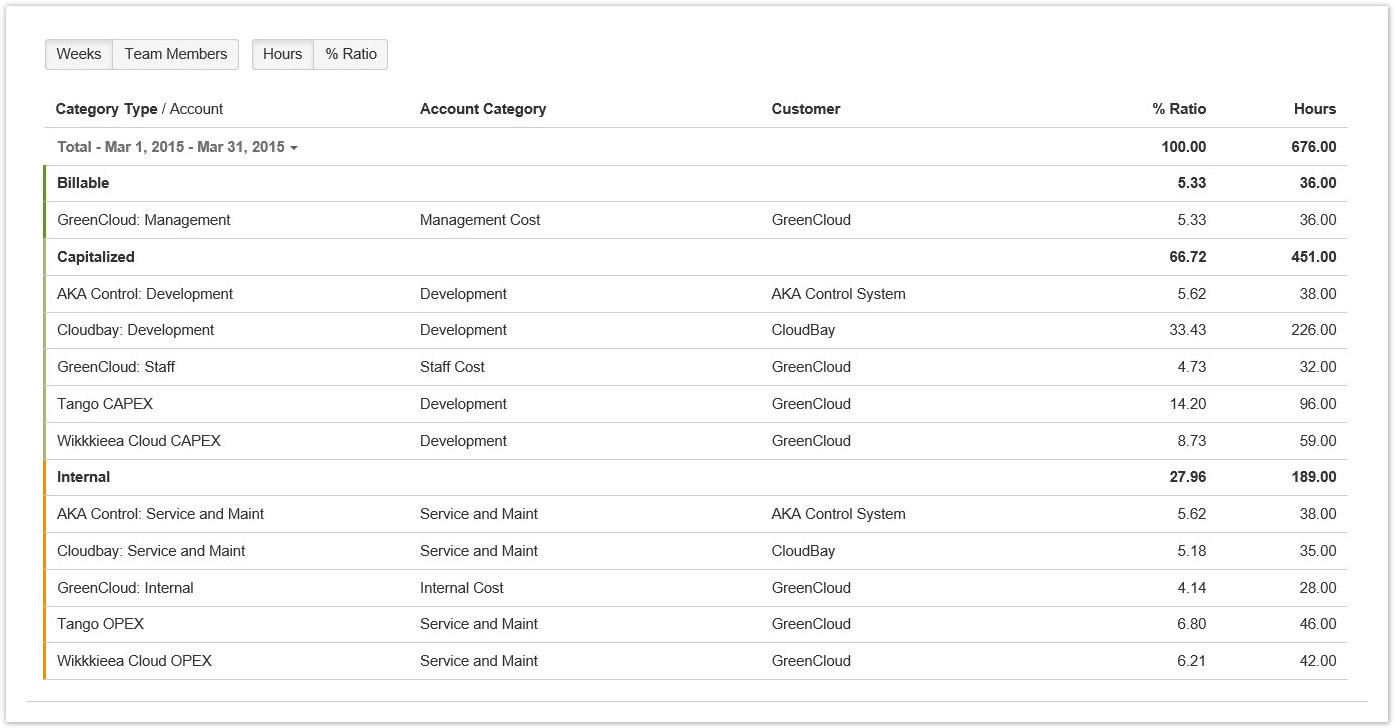
Example of a team utilization table
The team utilization table is displayed below the bar chart on the Team Utilization page.
Click to enlarge
Example of a team utilization bar chart
Click to enlarge
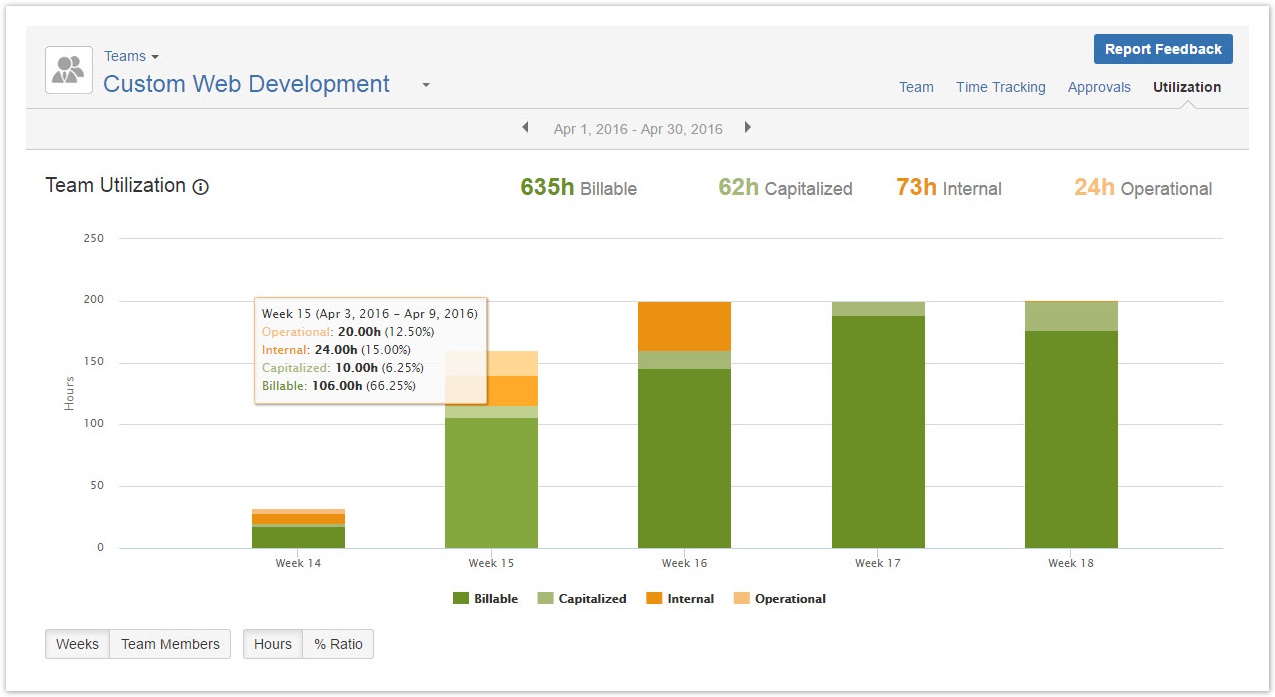
The totals at the top of the chart are rounded for readability.
| Tip | ||||
|---|---|---|---|---|
| ||||
|
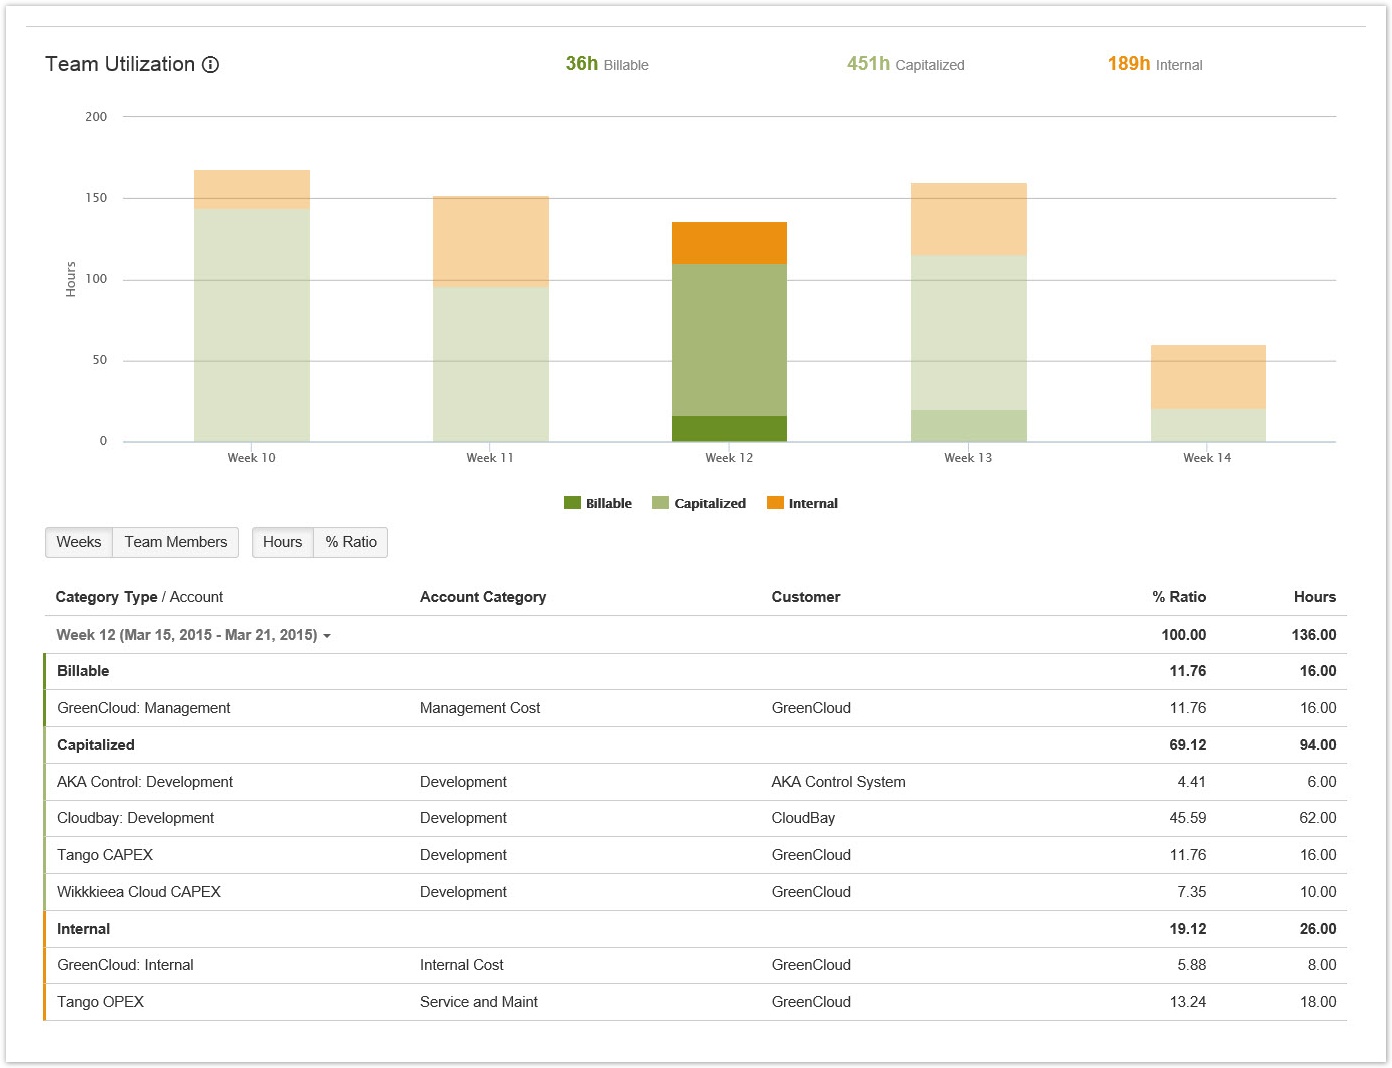
Displaying information for one bar
In the team utilization table, you can display information for a single bar of the chart by clicking the bar. You can reset the table to show all data from the chart by clicking the bar again.
Showing one week in table by clicking on bar in chart
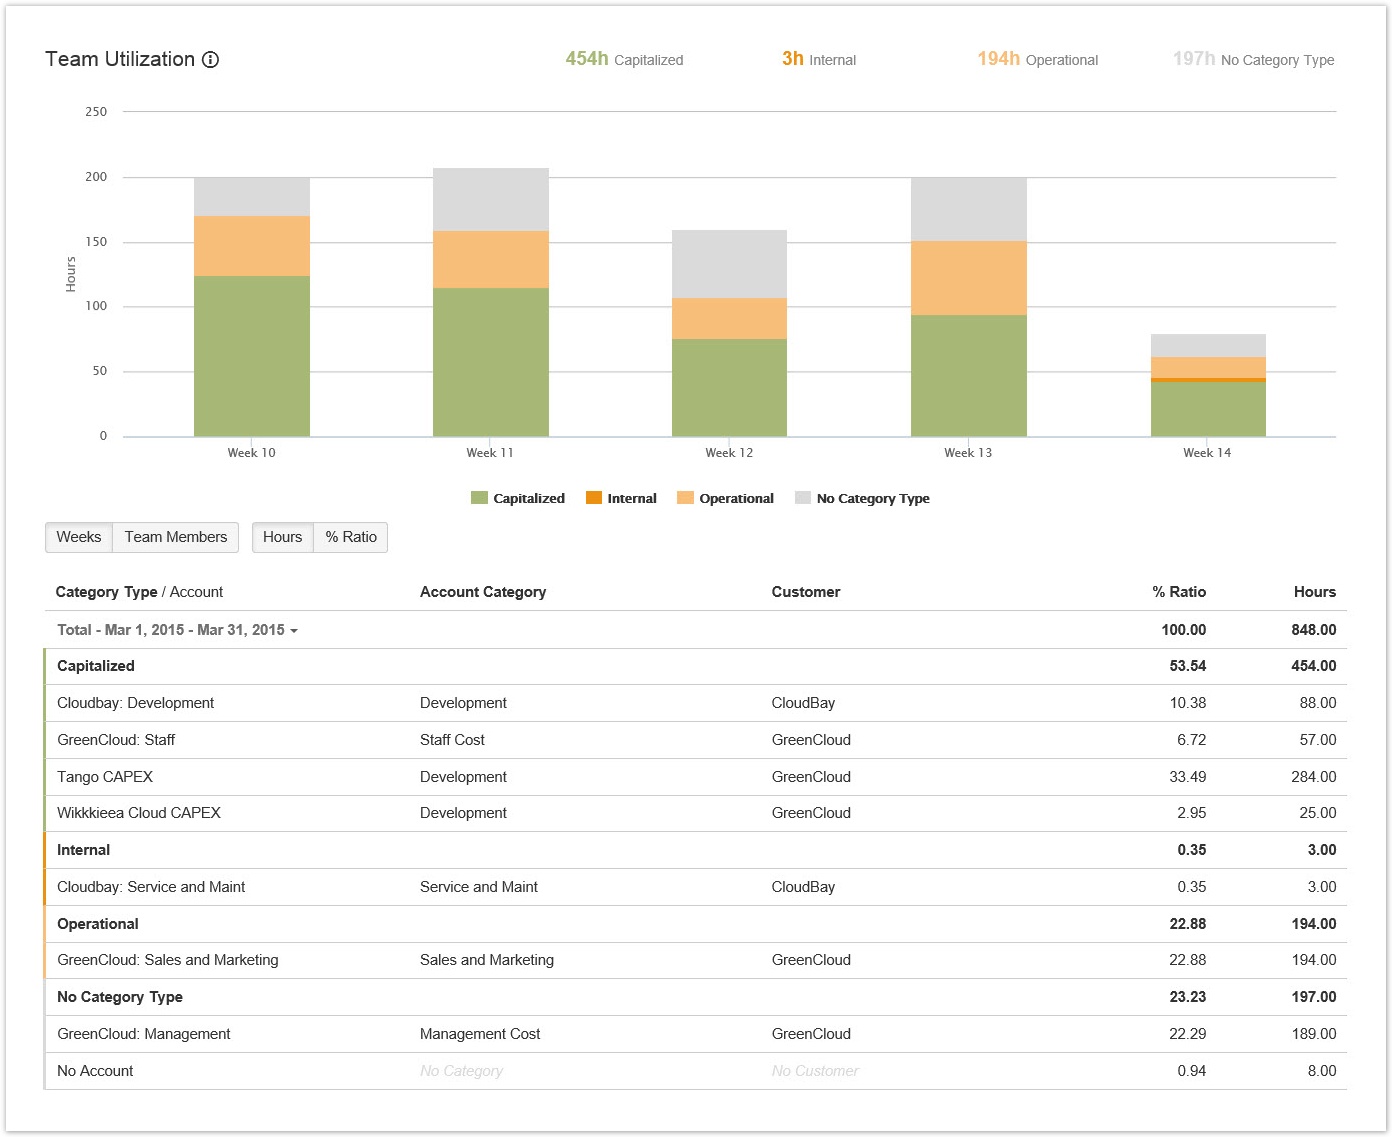
Missing data
If the account, account category, customer, or account category type is not defined for issues, logged time is displayed in gray in the chart and table. You can add the missing information by resolving unaccounted hours.
Missing data is indicated in gray
Related pages